News & Views: Open Access Charges – Continued Consolidation and Increases

This month we look at the latest data about Article Processing Charges (APCs). Per article pricing is a fundamental building block for all paid publishing models, so our review provides an invaluable insight into how costs of open access continue to evolve. This year, prices in general are increasing, some significantly. Important nuances in the distribution of prices continue to affect the value and cost of paid publishing models.
Background
Each year we survey the list Article Processing Charges (APCs) of a sample of major and significant publishers. Covering over 20,000 titles, and going back to 2016, our data set represents one of the most comprehensive reviews of open access pricing.
To compare like for like, we analyze non-discounted, CC BY charges. We take a snapshot at the end of every January, so we can track yearly changes while controlling for the different times of year that publishers may update prices.
Headline Changes
Going into 2024, we have seen significant price increases.
- Fully OA list prices across our sample have risen by around 9.5% compared with those set a year ago.
- Hybrid list prices have risen by an average of 4.2% over the same period.
- Maximum APCs for Fully OA journals remain at $8,900.
- Maximum APCs for Hybrid journals now top out at $12,290 (up $600 from last year).
- The last big jump in prices happened in 2020-2021, when the high-impact journals started offering OA options for the first time. This served to drag up average price increases. They subsequently fell back to averages. Underlying trends continue.
- There are almost 3x more Hybrid journals than Fully OA ones. Hybrid journals follow (or, rather, set) a similar pattern to the market overall.
- On average, Fully OA prices are around 62% of Hybrid prices. But, after a few years of widening, the gap is showing signs of narrowing – it was 58% last year but 63% the year before that.
- Around 31% of our sample of Fully OA journals charge no APCs.
- Price rises vary significantly by discipline. Arts & Humanities and Social Sciences have seen particularly large average increases, especially in Fully OA journal prices.
Price Distribution
Marketwide headline price changes mask important nuances. We have discussed previously that the most important nuance lies in the spread of prices within a given publisher’s portfolio. For example, if the bulk of a publisher’s journals lie towards the lower end of its pricing, with just a few journals priced at the high end, the average (mean) price will be higher than most authors pay.
The following figures show how the spread of prices plays out in the market across our sample of publishers. The figures are outlines of histograms, showing how many titles sit in various price bands over the successive years of data we have curated. The red line shows the most recent year’s prices. The lines become greener as they go further back in time. Subscribers to Delta Think’s Open Access Data and Analytics Tool can see full details of axes.
Hybrid Prices
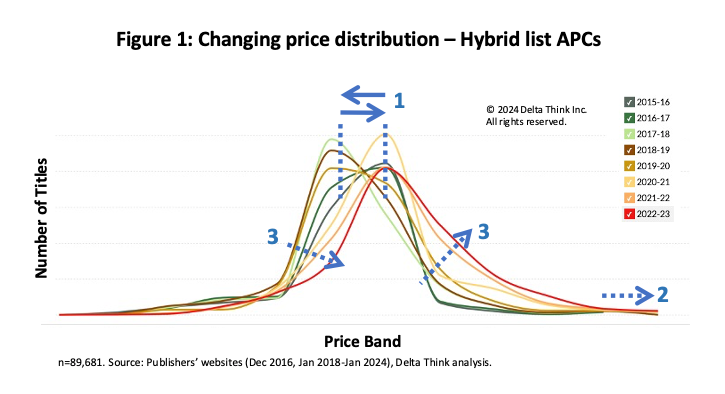
The spread of price bands for Hybrid journals is shown in Figure 1 below.
The overall spread of prices has remained relatively constant over time.
- A few years ago, in 2019-20, the most popular price band shifted slightly towards the lower end of the market and remained there for a few years. However, in 2021-22 it moved back up to its historic high and has remained there since.
- The very highest prices increased in 2020-21, when high-impact journals started offering Hybrid options. For clarity, the chart combines the very highest APCs into one band on the right-hand side.
- Average prices paid are heavily influenced by the shape of the curves on either side of the peak. Notice how the curve on the right side of the peak is becoming shallower over time. This suggests that increasing numbers of journals are priced higher than average, and so average prices paid will increase. The curve to the left of the peak was getting shallower, but it is now getting steeper. So, the moderating influence of lower-priced journals is now reducing. The height of the peak has not changed, suggesting that the total number of journals has not changed significantly since last year. We are therefore seeing a movement in price bands of existing journals to increase average prices paid, as higher APCs are becoming more prevalent.
Fully OA Prices
The Fully OA landscape is shown in Figure 2.
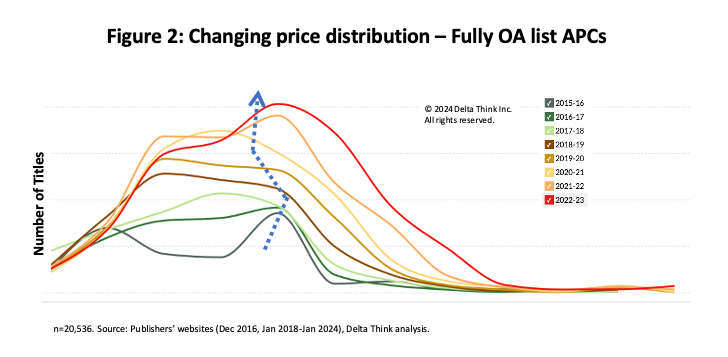
The data suggest that both the number of Fully OA journals and their average prices continue to increase.
- The peak of the curve is getting higher and moving to the right, so we are seeing an increase in the most popular price band and in average prices.
- The secondary peak suggests the presence of a significant number of journals cheaper than the most popular price band, which will serve to moderate the increase in average prices.
- However, as with Hybrids, the right-hand side of the curve is becoming shallower. The increasing number of more expensive journals will increase average prices paid.
- The height of the curve has also increased at the same time, illustrating that we are seeing an increase in total number of Fully OA journals.
Conclusion
It seems that the world of open access pricing is not immune to the effects of inflation. We have seen price increases most years, but going into 2024 they are noticeably higher than in previous years.
While outlying price changes are important general indicators, they do not necessarily shift the market on their own. Changes in the spread and emphasis of popular price bands play key roles too. The increasing proportion of higher-priced journals serve to increase the average prices actually paid.
As we explored at length in our analysis “APC Price Changes – When does up mean down?”, average headline price rises can lead to falling overall spend or vice versa, depending on the numbers of papers published and the spread of price increases across a portfolio.
One moderating influence is the high number of journals – usually Fully OA ones – that don’t charge APCs. These are typically paid for by some other means.
Per-APC information is useful in a wider context too. Even where deals are calculated based on bundles, they are often set by discounting from list APCs – especially where publication activity exceeds agreed caps. The high number of journals with no APCs will most likely have their sponsorship prices set based on per-paper revenues desired. Similarly, understanding revenues generated per paper is important to calculate thresholds for journal flips or for launching and sustaining a Subscribe to Open model.
Studying individual journal list APCs remains foundational for understanding pricing across all OA business models. Here we have covered average prices across the market. The averages vary depending on discipline. If you are curious how your APC pricing compares to the market, please contact us for a customized review.
This article is © 2024 Delta Think, Inc. It is published under a Creative Commons Attribution-NonCommercial 4.0 International License. Please do get in touch if you want to use it in other contexts – we’re usually pretty accommodating.