News & Views: Market Predictions During Economic Uncertainty

Dan Pollock and Ann Michael • April 6, 2020

Watch the companion News & Views online discussion forum here.


Predicting the Impact of Current Events


Scholarly publishers are wondering how the COVID-19 pandemic and the unfolding economic downturn will impact the scholarly journals market. Of course, this is an impossible question to answer definitively, but are there events in the past that we can use for guidance?


This month we look at the impact of the 2007-2008 financial crisis, bringing some longstanding historical analysis linking GDP and publishing revenues up to date. Our aim is to see what factors may act as a barometer of the economic impacts we might expect during this challenging time.


Historical View


The STM Association industry reports have done a great job of assembling figures, albeit from different sources which use different methodologies. The reports only go back to the mid-2000’s. Together, they suggest that:

  • The broader STM market managed to sustain growth rates of 4%-5% from 2007-2012, dropping steadily to around 3.5% going into 2021.
  • The Journals market averaged growth of 5%-6% from 2008-2011, dropping to 2.5% from 2013 onwards, and further to around 2.1% going into 2021.
  • Even the same sources may restate numbers as different analysts form different views, or as definitions change. There have been cases of higher growth figures mentioned but attributed to currency effects.


Despite the variability of historic data, we think it is fair to say that the Journals market has shown low to mid-single-digit growth, regardless of the economic cycle. In particular, the market weathered the 2007-2008 downturn well.

Historically, the volume of output has been driven by the continued real-terms growth in research and development expenditure and the rising number of researchers:

  • The numbers of articles (published annually) and journals have a long-term annual growth of 3.5% and 3% respectively.
  • Growth in output has accelerated to 4% per year for articles and over 5% for journals in recent years.
  • Some studies have placed article growth even higher – at around 6%.


Updating the historical baseline


The industry reports demonstrate a close relationship between numbers of journals, articles, and numbers of researchers. This seems intuitive. It is based on work dating from 20031 and includes data from 1990 to 1995.

To determine a baseline for comparison, we updated the 2003 view to see if the same factors held now, and if we could form a view that spanned the 2007-2008 downturn. We looked at data for:

  • Volume of article output – overall and in major indexes.
  • Gross domestic expenditure on research and development (GERD) and its relationship to GDP.
  • Population, numbers of researchers, and numbers of all workers in R&D.
  • Journal market growth (as stated in various industry reports).


We examined various combinations between the variables above to identify the strongest relationships. Subscribers to our Data and Analytics Tool can review the detailed data; below we present the headlines.

In the following results, all data are indexed relative to the year 2000, and CAGR spans 2000-2017. All sources have lead times, with some more recent data falling off-trend as a result.


Factors Related to Growth in Volume of Articles

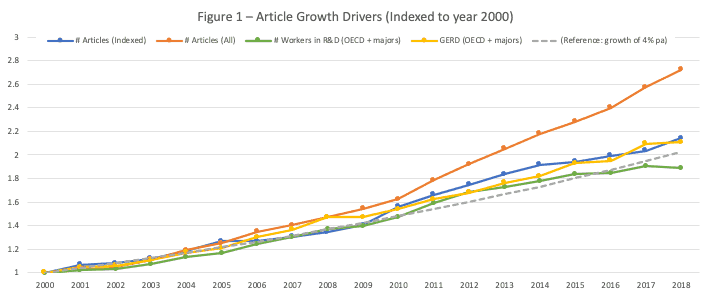
Sources: SCImago (Scopus), Dimensions, OECD, World Bank, Delta Think analysis. See footnotes for full citations.
© 2020, Delta Think Inc. All rights reserved.


The figure above examines the factors influencing growth in volume of articles.

  • Articles in indexed journals2 have a CAGR of 4.3% (the blue line).
  • Articles in the broader literature3 have a CAGR of 5.7% (the orange line).
  • This difference in numbers hints at a growing “long tail” of literature which lies outside the mainstream indexes. (Although not shown above, we see a similar pattern in numbers of journals.)
  • GERD4 (the yellow line) – particularly of the world’s largest economies, as tracked by the OECD5 – shows the strongest relationship with growth in numbers of articles. (99% correlation.)
  • The total number of workers in R&D in OECD countries (the green line) also shows a very strong relationship with growth in article output (and with growth in journal numbers – not shown, but notable). Note, this is all workers – not just researchers.
  • The number of researchers in R&D globally shows the strongest relationship with inflation-adjusted journal market value, followed by GERD and then average GDP per capita. (Around 80%-90% correlation.)


Projecting results to the future 


Activity remained pretty consistent across the 2007-2008 downturn, with downturns in GDP having little (if any) short-term effect on article volume. The 2003 analysis looking at researcher numbers largely holds true, albeit with the nuance of looking at all workers in R&D in countries with the largest economies.


Subscription revenues have historically weathered downturns well, as mild falls in activity do not lead to a collapse in subscriptions and subscription price is not directly tied to article volume. Price pressures are not new in the subscription market but may increase if institutional budgets are impacted by a weakening economy.


While the majority of scholarly publishing revenue is still derived from subscription models, Article Processing Charge-based (APC) Open Access now has roughly five times the market share it had in 2007-2008. Fully OA journals employing APC-based business models rely on article throughput. Their revenue could be more quickly impacted by article volume changes, putting some proportion of the 6.75% of total journal revenue that is associated with APCs at risk.


Additionally, with COVID-19 threatening to have a profound effect on the global workforce for an unknown period of time, the effective numbers of R&D workers across disciplines may fall at some point in the future. Currently, our anecdotal evidence points to an initial increase in submissions for many journals. We suspect this might be the result of researchers focusing on writing up results from completed research when they are unable to get into their labs.


However, this boost in activity may be short-lived. If significant numbers of researchers cannot continue their work, and we see a reduction in the number of personnel overall, then the data suggest we could see a reduction in article volume and in journal market value.


Conclusion 


When we started this analysis, our working hypothesis was that the scholarly journals market could pull off its old trick of weathering choppy waters well.


However, the data suggest that this time things may be different. The key factors related to journal market value look set to fall significantly, and the balance of business models across the marketplace has changed. It seems likely that a fall in the numbers of researchers and global economic activity will lead to a decline in the overall market size for journals publishing.

As is always the case, averages are not distributed equally throughout the market. Fully APC-based Open Access publishers are more at risk, because of their dependency on article volume and the close connection of their cash-flow to throughput. This reality may drive a shift towards non-APC based OA, such as subscription and membership models applied to OA.

Publishers with significant subscription-based income – especially the large ones – are (arguably) in the better position. However, they may see increased pricing pressure from a library market responding to deeper cuts in funding than we saw in 2007-2008. And, of course, any publishers relying on events will have seen these and similar in-person revenues disappear abruptly.


In fact, some mixed-model publishers may look to increased OA activities to help make up lost ground elsewhere. The same headwinds that challenge OA also make it more responsive.


We wish all our readers and their extended families, friends, and colleagues well through these challenging times.


Notes


Please note: since this piece was published, some minor edits were made to remove reference to GDP, and clarify the wording about journal market value.

  1. Mabe, M., 2003. The growth and number of journals. Serials, 16(2), pp.191–197. DOI:http://doi.org/10.1629/16191
  2. We use SCImago (based on Scopus) for the index. Web of Science will yield similar results.
  3. Dimensions.ai, filtered for Publication Type: Article.
  4. GERD: Gross domestic expenditure on research and development, shown as PPP at constant currencies. The World Bank normalizes to 2011 USD, the OECD to 2015 USD. Both sources experience lead times, and work on 2-year cycles for many countries (sometimes longer), so more recent data is likely to understate numbers. Methodologies have varied over time.
  5. OECD data covers OECD countries and prospective members: Australia, Austria, Belgium, Canada, Czech Republic, Denmark, Finland, France, Germany, Greece, Hungary, Iceland, Ireland, Italy, Japan, Korea, Luxembourg, Mexico, Netherlands, New Zealand, Norway, Poland, Portugal, Slovak Republic, Spain, Sweden, Switzerland, Turkey, United Kingdom, United States, Argentina, Chile, China, Chinese Taipei, Estonia, Israel, Latvia, Lithuania, Romania, Russia, Singapore, Slovenia, South Africa.

Sources


By Lori Carlin & Bonnie Gruber January 29, 2026
Building on last Spring’s survey of authors and researchers, we are once again analyzing responses from a large, global community to understand how shifts in the funding and policy environment are affecting research activity, priorities, and outlook. Conducted in partnership with 32 organizations, the Second edition of our Author–Researcher Survey was designed explicitly as a continuation of the work conducted in Spring 2025, allowing us to again take the pulse of authors-researchers, track emerging trends, and identify early signals related to real and perceived changes in U.S. science policy and research funding. With 12,122 completed responses from researchers in 125 countries , the Second survey again provides a robust and diverse dataset. Analysis is ongoing and the high-level structure of the respondent pool is already clear, closely mirroring, while subtly extending, what we observed in the Spring of 2025. A Global Community, with the U.S. at the Center of the Conversation The most recent respondent pool again reflects a truly global research community. Just over half of respondents are based in the United States, with others reporting from a broad range of countries worldwide. This near-even U.S./international split remains one of the defining features of the dataset and is particularly important given the survey’s focus on U.S. policy and funding dynamics. The results continue to underscore that changes originating in the U.S. research system are global in scope, closely watched and widely felt well beyond national borders. Science-Heavy Participation Anchored in Physical, Life, and Health Research Physical sciences represent the largest single area of engagement, alongside strong representation from the life sciences, health sciences, and engineering and technology. Social sciences and the arts and humanities account for a smaller share of responses, and as in prior responses, many participants report working across multiple fields. This pattern reflects both the interdisciplinary reality of modern research and the continuity needed to support meaningful year-over-year analysis. Insights Shaped Largely by Mid- and Senior-Career Researchers Mid- and senior-career respondents make up the majority of the sample, complemented by a substantial cohort of early-career researchers and representation from graduate and doctoral trainees. This reinforces that much of the insight emerging from the survey reflects the perspectives of researchers with long-term experience navigating funding cycles, institutional change, and strategic research planning. That experience is also evident in respondents’ professional roles. Faculty members and principal investigators account for the largest share of participants, alongside researchers, analysts, postdoctoral fellows, and graduate students. Clinically active professionals—including physicians and other healthcare providers—are also represented. The overall role mix remains highly consistent as compared to the Spring group, strengthening confidence that shifts observed in attitudes or behavior are not driven by changes in who is responding. Why This Continuity Matters One of the most important features of this current dataset is how closely its underlying demographic structure aligns with the Spring survey results. This consistency strengthens our ability to interpret changes in sentiment, expectations, and reported actions as genuine signals rather than artifacts of sampling. The scale and international reach of the most recent responses allow us to surface new nuances, particularly around how researchers are adapting to evolving policy signals, funding uncertainty, and institutional responses. What Comes Next We are digging into the full results to explore how researchers’ outlooks have evolved, including: Whether perceptions of funding stability and risk are shifting How researchers are adjusting research scope, timelines, or collaboration strategies Persistent signals related to mobility, field-level vulnerability, and longer-term confidence in the research enterprise Decisions about research funding, policy, and scholarly communication increasingly require evidence, not assumptions. Delta Think’s research process is designed to provide the scholarly communication community with the rigor, scale, and transparency needed to build sustainable strategies in an uncertain environment. From survey design through analysis and reporting, our approach emphasizes methodological consistency, careful segmentation, and openness about what the data can support. By maintaining continuity year over year, we aim to surface credible trendlines that stakeholders across the research ecosystem can trust. The Delta Think team designed this initiative to gather data and to support our partners across the scholarly ecosystem. By combining rigorous research design with deep industry context, we help publishers, societies, and institutions make informed, strategic decisions during periods of significant change. If you’re interested in learning more about the findings or discussing how they apply to your organization, we’d welcome the conversation. Please email Lori Carlin to get started.
By Dan Pollock & Heather Staines January 13, 2026
Overview This month we look at the changing mix of licenses in use among OASPA members and what these trends reveal for open access publishing more broadly. Introduction Each year OASPA surveys its member organizations to gather information about the volumes of output they publish in their fully OA and hybrid journals. These data provide a useful lens on how the most OA-committed publishers are approaching licensing and how that compares with the market as a whole. We’re delighted to be working with OASPA on its survey again this year. We process the raw data into consistent categories, normalize publisher names, and create visualizations of the data over time. We also produce a yearly blog post in cooperation with OASPA, outlining some of their results. Because space constraints limit what can be covered in OASPA’s own post, we explore additional angles here, placing OASPA member behavior in the context of Delta Think’s wider, market-level analysis. Subscribers to our Data and Analytics Tool can investigate the data further still. Our work with OASPA provides a complementary view into our market-wide analysis. Use of Licenses We can examine which common open access licenses are in use, as follows. 
By Lori Carlin December 4, 2025
Impelsys and Delta Think Join Forces to Expand Strategy and Technology Capabilities for Publishing, Scholarly Communications, Education, and Healthcare Communities
By Dan Pollock and Heather Staines December 2, 2025
Overview Each year, our scholarly market sizing update and analysis goes way beyond open access headlines. One consistent finding is that market share of open and subscription access is highly dependent on subject area. This month we look at how to best use our Delta Think Data and Analytics Tool (DAT) to understand and analyze these variations. With coverage of approximately 220 detailed subject areas, the data shows that headlines can sometimes mask important detail. Background Since we began our scholarly journal market analyses in 2017, one of our core objectives has been to enable deep analysis of our headline findings. Our annual market share updates represent a summing of data – more than 200 detailed subject areas, 200 or so countries, also split by society vs. non-society journal ownership. This level of detail is clearly too much for our monthly short-form analyses, so we present the market-wide headlines in our annual updates. However, by picking one subject area as an example, we can see how much nuance lies beneath the surface, and why these variations matter. Subscribers to DAT can use our interactive tools to quickly and easily see each level of detail and filter for just those relevant to their organization. Market Share Variation by Subject Area Our latest market headlines suggested that open access (OA) accounted for just under 50% of article output in 2024. However, this headline proportion varies considerably by subject area.
By Lori Carlin & Meg White November 19, 2025
Navigating Uncertainty, Innovation, and the Winds of Change As the Charleston Conference 2025 wrapped up, one thing was clear: scholarly communication continues to evolve against a backdrop of uncertainty: economic, technological, and policy-driven. Yet amid the turbulence, conversations throughout the week pointed toward resilience, adaptability, and even optimism. As Tony Hobbs observed during the Shifting Tides policy session, “the good news for scholarly communication is that due to technology advances, it is now possible to sail into the wind.” The Elephant in the Room: Doing More with Less Heather Staines Every conversation I had in Charleston seemed to circle back to one thing: budgetary uncertainty. Whether the concern was policy changes like potential caps on overhead or shifting grant funding or the ripple effects of declining enrollment, both domestic and international, everyone was asking how to do more with fewer resources. This theme ran through the plenary Leading in a Time of Crisis, Reclaiming the Library Narrative, and even the lightning sessions, a shared recognition that we’re all trying to redefine what “enough” looks like. What stood out was how data-driven decision-making has become essential. Libraries, publishers, and service providers are not just analyzing what to add, but what to let go of, all in an effort to find a new balance. And then there’s AI. We have moved beyond “sessions about AI” to “AI everywhere.” I will admit that I once thought AI was a solution in search of a problem, but now it’s woven through nearly every conversation. Librarians are leading the way on AI literacy, while publishers and service providers are using AI to innovate to meet changing research needs. The uncertainty is real but so is the shared determination to adapt, learn, and move forward together. The Long Arm of the Law and Its Reach into Scholarly Communication Meg White One of the things I love about Charleston is that there is always a moment that challenges me to reframe how I think about the work we do. This year’s Long Arm of the Law session did exactly that. It was a vivid reminder that the legal and policy currents swirling around us are not abstractions; they shape our ecosystem in ways we can’t afford to ignore. Paul Rosenzweig set the stage with a fascinating and lively walk through the history of executive orders. Hearing that Washington issued just eight while later presidents relied on them more frequently primarily to advance political agendas made the evolution very real. What stood out was the fine line between legitimate executive authority and overreach, and how easily those boundaries can blur. Nancy Weiss then brought the conversation directly into our lane with her analysis of an Executive Order directing the Institute of Museum and Library Services (IMLS) to reduce its activities to the bare legal minimum. Her experience as former General Counsel gave us an inside view of what such a directive could mean for libraries, museums, and cultural programs, all places where so much of our community’s work takes root. Sessions like this are why Charleston continues to be invaluable to me. They stretch my understanding, give me new context, and remind me that staying informed is part of how we navigate change together. Data-Driven Insights: The 2025 Author and Researcher Survey Lori Carlin My week was cut unusually short (for me) by other meetings I had to fly off to, but I still managed to squeeze in 2.5 days of interesting sessions, discussions, and ‘business casual’ gatherings. The first two events I attended this year were definite highlights, both of which were the brainchild of and brilliantly orchestrated by my colleague, Heather Staines – the Vendor Meetup on Monday evening and the Leadership Breakfast on Tuesday morning. Both were jam packed and filled with lively conversation. If you’re not familiar, the Vendor Meetup is an open, casual gathering (sponsored this year by Get FTR) designed to give vendor representatives, especially early career attendees, who attend only for Vendor Day a chance to socialize and network, something they often miss when they’re in and out in a single day, but all are welcome to attend! The Leadership Breakfast, a smaller invitation-only event designed to give a more intimate networking experience within the larger Charleston Conference, is always a thoughtful session centered on a pressing issue of the day, and this year was no exception. The discussion focused on sustainability across the entire scholarly communication ecosystem—from funders to libraries to publishers. Frankly, no one can unhear the words of one of the panelists (a library director) when he commented that his budget has dropped from ~$7M to ~$5.4M in the last 24 months … with more to come. Finally, I’m a little biased, but I dare say I and my panelists were very pleased with the session I moderated focused on the impact of US research funding changes, which highlighted info from Delta Think’s Spring 2025 Author and Researcher Survey, along with how publishers who participated used the data to inform their strategies. We also had a librarian on the panel who informed the audience about the impact of these changes on universities overall and libraries in particular. As you may know, the survey data showed rising concern about institutional support, with many researchers rethinking how they publish and participate in conferences. Respondents also described how tightening budgets are straining peer review and research dissemination, while responses varied sharply between U.S.-based and international authors, reflecting distinct policy and institutional pressures, it also showed that the impact is being felt globally. In the tradition of Charleston, what made the session so powerful was the discussion. Colleagues from societies, publishers, and libraries focused on how they are using these insights to understand the challenges and to act on them. From adjusting publishing strategies to helping researchers to growing relationships in other markets, to shaping advocacy and outreach activities, organizations are using these insights to inform resource and budget direction in innovative ways. For me, that was the real takeaway: turning evidence into collaboration, and progress. Even in uncertain times. We’re running the survey again now with plans to compare results to the Spring version. If you’re interested, there is still time to sign up! End of An Era (Two, in Fact!) This year’s conference marked a pivotal moment: the first without the in-person presence of founder, Katina Strauch (though we were grateful for her virtual participation), and the well-earned retirement of longtime Conference Director Anthony Watkinson, who rang his iconic bell one last time. We would not be here without them and their visionary colleagues who built this community from the ground up. Thank you, Katina and Anthony. Charting What Comes Next If there was one metaphor that captured Charleston 2025, it was motion; not adrift, but deliberate progress in the face of resistance. From policy updates to AI integration to the enduring strength of the scholarly community, the week’s sessions affirmed that innovation often takes root during uncertainty. As Tony Hobbs reminded us, even headwinds can propel us forward — if we learn how to adjust our sails.
By Heather Staines November 6, 2025
We are proud to share a video recording of our October News & Views companion online discussion forum! Join us for our annual update on the volume and revenue associated with Open Access publishing. If you missed the session, or if you attended and would like to watch/listen again, or share forward with friends, please feel free!
By Dan Pollock and Heather Staines October 21, 2025
Overview After a rocky couple of years, the open access (OA) market may be finding its footing again. Each year, Delta Think's Market Sizing analyzes the value of the OA scholarly journals market—that is, the revenue generated by providers or the costs incurred by buyers of content. Our analysis estimates that the OA segment expanded to just under $2.4bn in 2024. Although growth has improved compared with last year’s deceleration, it continues to lag behind the broader historical trend for OA. The proportion of articles published as OA has declined slightly, likely driven by continued reduction in the output from the large OA publishers. This trend has benefited established publishers, who saw growth in OA activity and revenue as they continued to consolidate their positions. Looking ahead, OA could soon begin outpacing the broader journals market once again—but likely through different growth drivers than in the past. Read on to see what those shifts might look like. Headline findings Our models suggest the following headlines for the 2024 open access market:
By Lori Carlin & Meg White October 13, 2025
Collaborate with Delta Think to uncover how funding and policy uncertainty continue to reshape the research ecosystem — and gain tailored insights for your community.
By Lori Carlin & Meg White September 25, 2025
Introduction: One question, two paths  A recent essay in The Conversation posed the question, “Is ChatGPT making us stupid?” The author examined emerging research suggesting that over-reliance on AI tools for writing can dull critical thinking, originality, and even memory retention. But as the author points out, AI has the potential to augment human intelligence when used well , acting as a catalyst for deeper thinking rather than a shortcut around it. We agree and seek to guide our clients in determining how to use AI to strengthen research and scholarship. From concern to opportunity When AI is approached as a collaborator, it sparks creativity, deepens inquiry, accelerates problem-solving, and amplifies creativity. It can strengthen teams, enhance services, and improve efficiencies across the publishing enterprise. Turning Ideas into Action Here’s how Delta Think can help you transform smart AI potential into purposeful, strategic action: Strategy and Market Research Focus: Identify where AI can deliver the most value for your organization, grounded in community needs and behaviors. Delta Think Approach: Gather and analyze evidence through quantitative and qualitative methods to uncover how your community – your researchers, authors, reviewers, and readers – are using AI now or, better yet, where and how they could be using it in the future. Marrying their unmet needs with your strategic goals creates your roadmap to future success. 2. Build vs. Buy Decisions for AI-Powered Products Focus: Develop proprietary AI solutions, partner with trusted vendors, or combine the best of both approaches to suit your needs. Delta Think Approach: Assess your current state and future needs, design decision frameworks that weigh cost, capability, risk, speed-to-market, and long-term scalability, and build the approach that will work best to support your business goals and community needs. 3. AI Policy and Governance Focus: Ensure responsible, transparent, and ethical AI use that safeguards scholarly integrity. Delta Think Approach: Facilitate the development of your AI governance with the creation of important guardrails and policies, working to mitigate bias and hallucination risks, safeguarding research integrity while enabling innovation. 4. UX/UI Testing for AI Products and Features Focus: Design AI experiences that enhance human engagement. Delta Think Approach: Test results, interfaces, prompts, and transparency signals to keep users informed, empowered, and confident in your products and tools. 5. Licensing and Partnership Strategy Focus: Leverage commercial arrangements to unlock AI potential while aligning with your mission and values. Delta Think Approach: Guide you through licensing agreements, proprietary data partnerships, and collaborations that create sustainable competitive advantage and strategic revenue streams. Turning Ideas into Impact By reframing the conversation from Can AI substitute scholarship? to How does AI amplify scholarship? , publishers can lead the next wave of innovation. Delta Think’s collaborative approach ensures that your organization’s adoption of AI enhances creativity, critical thinking, and trust. We can help you map out your bespoke AI-strategy roadmap, develop new products and services, test prototypes, and design governance guidelines. Reach out today or schedule some time at the Frankfurt Book Fair (10/14-16) to discuss how Delta Think’s expertise and proven methodologies can help your organization unlock key insights and drive innovation.
By Dan Pollock and Heather Staines September 9, 2025
How might planned cuts to funding of the US National Science Foundation affect scholarly output? In our last News & Views we analyzed how the headline cuts might apply to relevant activities. This month we examine how journals may be impacted and model some scenarios quantifying the impact on global scholarly output. Background The US National Science Foundation is an independent US federal agency that supports science and engineering across the US and its territories. In its 2024 financial year (FY) 1 , it spent around $9.4 billion, funding approximately 25% of all federally supported research conducted by US colleges and universities. In July we looked at how reported funding cuts and NSF budget cuts proposed by the US Government might affect the NSF’s output of research papers. We found that in the near term the effects would be limited, as the cuts focus on NSF activites that produce low volumes of papers. However, cuts proposed over the coming year may have a more profound effect as they are deep and affect research activities. We have also previously analyzed proposed cuts to funding of the National Institutes of Health (NIH). We noted how cuts to the world’s largest producer of biomedical research could have a profound effect on publication outputs. So how do cuts to the NSF stack up? The effects on journals As ever, the headlines and averages are unevenly distributed, so we looked at how individual journals might be affected.