News & Views: Will cuts to National Science Foundation funding affect scholarly publishing activity?

Dan Pollock & Heather Staines • July 29, 2025

The US Government has planned cuts to funding of the US National Science Foundation (NSF) in 2025 and 2026. Before we can undertake a full analysis of how these cuts might affect publishers, we must unpack some data. This month we put the cuts in context, looking at how the cuts impact research and the scale of NSF output. And we find they may not affect research in the ways the headlines suggest. We will follow up with a future analysis modelling specific scenarios of impacts on publisher submissions.


Background


The US National Science Foundation is an independent US federal agency that supports science and engineering across the US and its territories. In its 2024 financial year (FY)1, it spent around $9.4 billion, funding approximately 25% of all federally supported research conducted by US colleges and universities.


In May 2025, the New York Times (NYT) published an article analyzing proposed cuts to NSF funding by the current US Government. The NYT’s analysis suggested a 51% cut in funding from 1 January through 21 May 2025, with a further 56% reduction proposed for next year2.


We have previously analyzed effects of proposed cuts to funding of the National Institutes of Health (NIH). The proposed cuts to the NSF are deeper, so might they have an even greater negative effect on publication volumes?


Understanding what the cuts apply to


The 51% cut in 2025 covers 140 days, equivalent to a 20% annualized cut. So could we see the same level of reduction in papers this year? And could this be followed be a 56% drop next year, as the 2026 cuts cover a full year?


As with our analysis of the NIH, we need to understand how the changes in funding translate into research activities, and thence into corresponding volumes and timing of publication output. We therefore analyzed the NSF’s own budgetary figures to put the cuts into context.


Sources: OpenAlex, Research Organization Registry, NSF, New York Times, Delta Think Analysis.

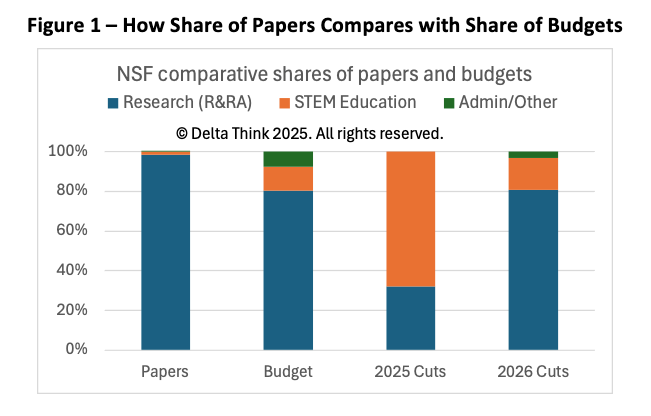
The figure above compares distributions of papers with budgetary activity between key NSF activities.


  • The left-most bar (“Papers”) shows that over 98% of papers arising from NSF activities result from its research grants (which it terms Research and Related Activities or R&RA). The papers arising from the STEM Education program account for around 1.7% of output (the thin orange slice at the top).
  • Compare these proportions with share of budget (second-left bar, “Budget”, spanning a like-for-like period3). Around 80% of the NSF’s budget has been spent on research activites and just over 12% on STEM programs.
  • The “2025 Cuts” bar shows the relative proportions of the NYT’s headlines for the 2025 cuts. The lion’s share of these affects the STEM Education program.
  • The “2026 Cuts” bar analyzes the NSF’s own 2026 budget proposals, which show even deeper cuts that those suggested by the NYT's analysis. Their split between research and other activities roughly matches the historic budget proportions4.


The key takeway is that cuts do not necessarily relate to research activity and therefore to resulting publications. For example, we can see that a large cut in STEM budget in 2025 will likely have a small effect on output of papers, because STEM Education accounts for such a low share of output. Even if STEM Education were cut by 100%, it would affect no more than the 1.7% or so of related papers produced. Conversely, the proposed 2026 cuts are deep, mostly affect research ouput, and so could lead to a significant reduction in papers.


How much does the NSF influence global publications?


We can add the NSF data to our previous analysis of key US federal funders of research as follows.

Sources: US Federal Budgets, OpenAlex, Research Organization Registry, NSF, New York Times, Delta Think Analysis.

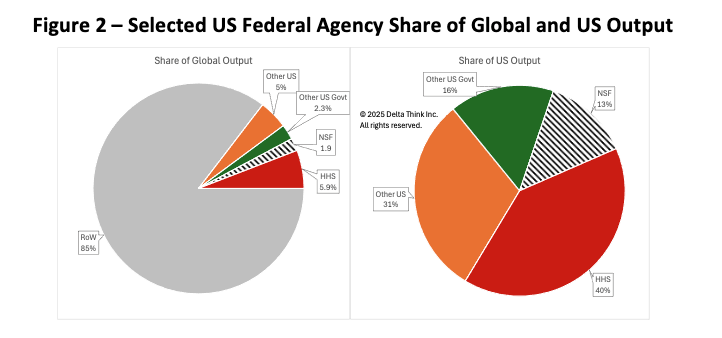
The charts above show the output funded by the NSF and the Department of Health and Human Services (HHS) as a share of global output (left) and US output (right).


  • The US accounted for around 15% of global output.
  • The NSF accounted for just under 2% of global output, and just over 13% of US output.
  • The HHS, which includes the Centers for Disease Control and Prevention (CDC) and National Institutes of Health (NIH), accounted for just under 6% of global output, around 40% of US output. The NIH accounted for 95% of HHS output (not shown above).
  • Note: the data span the previous 5 years, and the samples are based on OpenAlex data, where papers are indicated to have the funders as classified above, or by one of their subsidiaries (as best we can estimate).


The NSF produces around one third of the papers compared to the HHS. Together they account just under 8% of global output – and just over 10% if other US Government output is added. Significant reductions in output from these agencies would therefore be noticeable globally, but more a drag on performance than a catastrophic collapse. However, the effects for journals and publishers relying heavily on US-authored papers could be profound. Referring to the right-hand chart above, these latter constitute over 53% of output from the two major agencies, or 69% if the rest of US Governement-funded papers are included.


Conclusion


As ever, headline numbers need unpacking to get to a meaningful analysis of impact. The big cuts to NSF in 2025 funding fall largely on departments that produce few publications, and so publishers will likely remain unaffected by them. The NSF alone accounts for just under 2% of global publications, so again, the effects of cuts on publications will likely be minor.


However, for publishers and journals heavily reliant on US researchers, things are different. Although not as big as the HHS (and NIH), the NSF is still a significant funder of papers from the US. The effects will be even more profound for specific journals and also will be reliant on the cuts in grants. In the second part of this analysis, planned for later this summer, we will look at how many journals may be significantly impacted, and model some scenarios quantifying impact on publishers in more depth.


---


1 Financial years run October to September. E.g. the 2024 financial year ran from 1 October 2023 through 30 September 2024. This is the same as most US federal agencies, including the others we have analyzed (CDC, NIH, HHS).

2 The NYT did not specify which year the 56% cuts to “next year” applied to. Given the NYT article was written just past mid-way through the FY 2025, it seems reasonable to assume the 56% cuts “next year” apply to the FY 2026 (starting from 1st October 2025).

3 To compare like for like we averaged data spanning 5 years from 2019. This avoids recent changes and rearrangements of budgets reported by the NSF.

4 For FY 2026, the NSF moved STEM to be part of research, so we separated it back out to compare like-for-like historically.


---


This article is © 2025 Delta Think, Inc. It is published under a 
Creative Commons Attribution-NonCommercial 4.0 International License. Please do get in touch if you want to use it in other contexts – we’re usually pretty accommodating.


TOP HEADLINES


NIH to crack down on excessive publisher fees for publicly funded research – July 16, 2025


"As part of its ongoing commitment to scientific transparency and responsible stewardship of taxpayer dollars, the National Institutes of Health (NIH) today announced plans to implement a new policy that will cap how much publishers can charge NIH-supported scientists to make their research findings publicly accessible."


MDPI Signs First North American Agreement with Canadian Consortium – July 14, 2025


"The Multidisciplinary Digital Publishing Institute (MDPI) has signed its first consortium agreement in North America, marking a significant milestone for the fully Open Access publisher. The agreement is with the Federal Science Libraries Network (FSLN) and will last for two years."


B17 conference outcomes released – July 8, 2025


"Earlier this year, the 17th Berlin Open Access Conference (B17) brought together national delegations of research institutions and their libraries from around the world to assess progress in their transformation strategies, collectively advancing a more open scholarly publishing system and addressing emerging challenges in the increasingly complex research communication ecosystem."


DIAMAS results will change the face of Diamond OA – July 2, 2025


"The DIAMAS final conference celebrated the 9 project outputs that have been integrated into the European Diamond Capacity Hub (EDCH) in Brussels on 3 June 2025. It shone a light on how DIAMAS outputs will support the community to implement and sustain the Diamond OA model in Europe and beyond."


Knowledge Unlatched Finds a New Home with Annual Reviews – June 26, 2025


"Annual Reviews today announced that it has signed an agreement with Wiley that enables Knowledge Unlatched (KU) – most recently owned and operated by Wiley – to move to a new home within the Annual Reviews organization. The move supports one of the most recognized initiatives in open access publishing and marks KU’s return to nonprofit stewardship."


OA JOURNAL LAUNCHES


New open-access journal AI for Science aims to revolutionize scientific discovery July 2, 2025


"IOP Publishing has partnered with the Songshan Lake Materials Laboratory in China to launch a new diamond open-access journal to showcase how artificial intelligence (AI) is driving scientific innovation. AI for Science (AI4S) will publish high-impact original research, reviews, and perspectives to highlight the transformative applications and impact of AI."


By Lori Carlin & Meg White February 26, 2026
Trust is what allows research to function. It enables collaboration, supports editorial decision-making, and underpins the credibility of the scholarly record. Today, that trust is increasingly being tested. Competitive pressures, new forms of manipulation, and rapidly evolving technologies are raising both the volume and complexity of integrity risks. And our community is responding with clearer standards, better training, smarter workflows, and responsible innovation, strengthening the systems that protect confidence in science and scholarly publishing.  The STM Research Integrity report makes clear that the community is fully engaged. Publishers have invested heavily in dedicated teams, screening technologies, and workflow integration, and are focused on proactive prevention. However, the report does highlight a persistent challenge: expectations around research integrity are rising faster than many organizations’ ability to define, implement, and operationalize them consistently The gap between expectation and execution is where many publishers and societies are now focused. Defining What “Good” Research Integrity Practice Looks Like One of the report’s central insights is the diversity of approaches publishers have taken to building research integrity capacity. Team size, tool adoption, workflow design, and policy scope vary widely—often for good reasons related to scale, discipline, and business model. However, this diversity also makes it difficult for organizations to answer basic questions internally: What does “good” look like for us? Which capabilities are essential now, and which can follow later? How do we know whether our current approach is proportionate to the risks we face? The STM report shows that effective integrity practice is about ensuring that policies, processes, and systems are coherent and fit for purpose. Translating this into action requires clear frameworks that help organizations define integrity expectations in ways that are realistic and aligned with their publishing context. Turning Policy into Day-to-Day Practice Integrity infrastructure only works if it is deployed consistently across the publication lifecycle. Clear policies must be supported by screening checkpoints, escalation pathways, investigation protocols, and well-defined roles for editors, integrity teams, and external partners. In practice, many organizations struggle at this stage. Policies may exist on paper but are unevenly applied. Screening tools may generate signals without clear guidance on interpretation. Editors may be unsure when and how to escalate concerns. The report illustrates how publishers who have made the greatest progress have focused on integration—embedding integrity checks into submission, peer review, revision, and pre-acceptance workflows, and ensuring that staff and editors understand how these pieces fit together. Achieving this level of operational clarity requires deliberate design. Investing in Technology Without Losing Human Judgement Technology plays a central role as an enabler rather than a solution. Tools surface signals; people make decisions. Managing false positives, avoiding workflow bottlenecks, and maintaining editorial confidence remain ongoing challenges. For publishers and societies, the practical questions are how to select, combine, and govern tools so that they best support existing processes. The report underscores a foundational tenet of Delta Think’s consultancy: evidence-based decision-making is paramount in understanding what tools will deliver in practice, what processes will best interact with workflows, and where additional human expertise is required. From Expectation to Implementation Research integrity is an operational capability that publishers and societies are defining, building, and most importantly, need to continuously refine. Research Integrity ‘success’ will depend on a combination of tools, services, processes, and training consistently refined and applied. This is where Delta Think’s focused, evidence-led approach can make a tangible difference. We work with publishers and societies to interpret sector expectations, assess current vs. best-in-class capabilities, and design innovative roadmaps. Reach out today to discuss how we can partner to ensure your research integrity practices and processes are performing at peak efficiency and effectiveness.
By Dan Pollock & Heather Staines February 10, 2026
This edition of News & Views looks at the changing patterns of license use over time. Are licenses becoming more or less permissive and what are the implications for scholarly publishers? Introduction Last month we compared the patterns of license use as reported by the members of the Open Access Scholarly Publishers Association (OASPA) with those observed in the wider scholarly journals market. Our comparison looked at the aggregated total numbers of licenses during the years 2015-2024. This showed a useful snapshot of the complete 10-year period spanned by the data. But how has the use of license types changed over that time? This month we dive into the temporal changes, focusing on the core scholarly journals market based on data in our Data and Analytics Tool (DAT). DAT allows for multiple comparisons and in-depth analysis, and, in this edition of News & Views, we highlight a couple of interesting examples of trends over time. The different types of OA licenses We start by focusing on only Open Access (OA) journal output. Many funders and institutions mandating OA also insist on certain OA license types, typically more permissive CC0 or CC BY licenses (to be consistent with the foundational Budapest Open Access Initiative ). However, more restricted licenses, such as those prohibiting commercial or derivative use, are also broadly used. For the purposes of our analysis, we define these as follows. “Permissive” refers to articles published under CC0 or CC BY licenses. These are the ones defined as required by major OA advocates, such as Plan S , Wellcome , HHMI , etc. “Restricted” refers to articles published under other licenses that allow limited reuse, such as CC BY-NC (non-commercial), CC BY-ND (no derivatives), or publisher-specific licenses. Although not conforming to the strictest OA mandates, such licenses are widely used and are consistent with many mandated OA requirements. Publishers sometimes charge lower APCs for these more restrictive licenses compared with their permissive counterparts. Data comparing the use of permissive vs. restricted licenses in open access output is shown below.
By Lori Carlin & Bonnie Gruber January 29, 2026
Building on last Spring’s survey of authors and researchers, we are once again analyzing responses from a large, global community to understand how shifts in the funding and policy environment are affecting research activity, priorities, and outlook. Conducted in partnership with 32 organizations, the Second edition of our Author–Researcher Survey was designed explicitly as a continuation of the work conducted in Spring 2025, allowing us to again take the pulse of authors-researchers, track emerging trends, and identify early signals related to real and perceived changes in U.S. science policy and research funding. With 12,122 completed responses from researchers in 125 countries , the Second survey again provides a robust and diverse dataset. Analysis is ongoing and the high-level structure of the respondent pool is already clear, closely mirroring, while subtly extending, what we observed in the Spring of 2025. A Global Community, with the U.S. at the Center of the Conversation The most recent respondent pool again reflects a truly global research community. Just over half of respondents are based in the United States, with others reporting from a broad range of countries worldwide. This near-even U.S./international split remains one of the defining features of the dataset and is particularly important given the survey’s focus on U.S. policy and funding dynamics. The results continue to underscore that changes originating in the U.S. research system are global in scope, closely watched and widely felt well beyond national borders. Science-Heavy Participation Anchored in Physical, Life, and Health Research Physical sciences represent the largest single area of engagement, alongside strong representation from the life sciences, health sciences, and engineering and technology. Social sciences and the arts and humanities account for a smaller share of responses, and as in prior responses, many participants report working across multiple fields. This pattern reflects both the interdisciplinary reality of modern research and the continuity needed to support meaningful year-over-year analysis. Insights Shaped Largely by Mid- and Senior-Career Researchers Mid- and senior-career respondents make up the majority of the sample, complemented by a substantial cohort of early-career researchers and representation from graduate and doctoral trainees. This reinforces that much of the insight emerging from the survey reflects the perspectives of researchers with long-term experience navigating funding cycles, institutional change, and strategic research planning. That experience is also evident in respondents’ professional roles. Faculty members and principal investigators account for the largest share of participants, alongside researchers, analysts, postdoctoral fellows, and graduate students. Clinically active professionals—including physicians and other healthcare providers—are also represented. The overall role mix remains highly consistent as compared to the Spring group, strengthening confidence that shifts observed in attitudes or behavior are not driven by changes in who is responding. Why This Continuity Matters One of the most important features of this current dataset is how closely its underlying demographic structure aligns with the Spring survey results. This consistency strengthens our ability to interpret changes in sentiment, expectations, and reported actions as genuine signals rather than artifacts of sampling. The scale and international reach of the most recent responses allow us to surface new nuances, particularly around how researchers are adapting to evolving policy signals, funding uncertainty, and institutional responses. What Comes Next We are digging into the full results to explore how researchers’ outlooks have evolved, including: Whether perceptions of funding stability and risk are shifting How researchers are adjusting research scope, timelines, or collaboration strategies Persistent signals related to mobility, field-level vulnerability, and longer-term confidence in the research enterprise Decisions about research funding, policy, and scholarly communication increasingly require evidence, not assumptions. Delta Think’s research process is designed to provide the scholarly communication community with the rigor, scale, and transparency needed to build sustainable strategies in an uncertain environment. From survey design through analysis and reporting, our approach emphasizes methodological consistency, careful segmentation, and openness about what the data can support. By maintaining continuity year over year, we aim to surface credible trendlines that stakeholders across the research ecosystem can trust. The Delta Think team designed this initiative to gather data and to support our partners across the scholarly ecosystem. By combining rigorous research design with deep industry context, we help publishers, societies, and institutions make informed, strategic decisions during periods of significant change. If you’re interested in learning more about the findings or discussing how they apply to your organization, we’d welcome the conversation. Please email Lori Carlin to get started.
By Dan Pollock & Heather Staines January 13, 2026
Overview This month we look at the changing mix of licenses in use among OASPA members and what these trends reveal for open access publishing more broadly. Introduction Each year OASPA surveys its member organizations to gather information about the volumes of output they publish in their fully OA and hybrid journals. These data provide a useful lens on how the most OA-committed publishers are approaching licensing and how that compares with the market as a whole. We’re delighted to be working with OASPA on its survey again this year. We process the raw data into consistent categories, normalize publisher names, and create visualizations of the data over time. We also produce a yearly blog post in cooperation with OASPA, outlining some of their results. Because space constraints limit what can be covered in OASPA’s own post, we explore additional angles here, placing OASPA member behavior in the context of Delta Think’s wider, market-level analysis. Subscribers to our Data and Analytics Tool can investigate the data further still. Our work with OASPA provides a complementary view into our market-wide analysis. Use of Licenses We can examine which common open access licenses are in use, as follows. 
By Lori Carlin December 4, 2025
Impelsys and Delta Think Join Forces to Expand Strategy and Technology Capabilities for Publishing, Scholarly Communications, Education, and Healthcare Communities
By Dan Pollock and Heather Staines December 2, 2025
Overview Each year, our scholarly market sizing update and analysis goes way beyond open access headlines. One consistent finding is that market share of open and subscription access is highly dependent on subject area. This month we look at how to best use our Delta Think Data and Analytics Tool (DAT) to understand and analyze these variations. With coverage of approximately 220 detailed subject areas, the data shows that headlines can sometimes mask important detail. Background Since we began our scholarly journal market analyses in 2017, one of our core objectives has been to enable deep analysis of our headline findings. Our annual market share updates represent a summing of data – more than 200 detailed subject areas, 200 or so countries, also split by society vs. non-society journal ownership. This level of detail is clearly too much for our monthly short-form analyses, so we present the market-wide headlines in our annual updates. However, by picking one subject area as an example, we can see how much nuance lies beneath the surface, and why these variations matter. Subscribers to DAT can use our interactive tools to quickly and easily see each level of detail and filter for just those relevant to their organization. Market Share Variation by Subject Area Our latest market headlines suggested that open access (OA) accounted for just under 50% of article output in 2024. However, this headline proportion varies considerably by subject area.
By Lori Carlin & Meg White November 19, 2025
Navigating Uncertainty, Innovation, and the Winds of Change As the Charleston Conference 2025 wrapped up, one thing was clear: scholarly communication continues to evolve against a backdrop of uncertainty: economic, technological, and policy-driven. Yet amid the turbulence, conversations throughout the week pointed toward resilience, adaptability, and even optimism. As Tony Hobbs observed during the Shifting Tides policy session, “the good news for scholarly communication is that due to technology advances, it is now possible to sail into the wind.” The Elephant in the Room: Doing More with Less Heather Staines Every conversation I had in Charleston seemed to circle back to one thing: budgetary uncertainty. Whether the concern was policy changes like potential caps on overhead or shifting grant funding or the ripple effects of declining enrollment, both domestic and international, everyone was asking how to do more with fewer resources. This theme ran through the plenary Leading in a Time of Crisis, Reclaiming the Library Narrative, and even the lightning sessions, a shared recognition that we’re all trying to redefine what “enough” looks like. What stood out was how data-driven decision-making has become essential. Libraries, publishers, and service providers are not just analyzing what to add, but what to let go of, all in an effort to find a new balance. And then there’s AI. We have moved beyond “sessions about AI” to “AI everywhere.” I will admit that I once thought AI was a solution in search of a problem, but now it’s woven through nearly every conversation. Librarians are leading the way on AI literacy, while publishers and service providers are using AI to innovate to meet changing research needs. The uncertainty is real but so is the shared determination to adapt, learn, and move forward together. The Long Arm of the Law and Its Reach into Scholarly Communication Meg White One of the things I love about Charleston is that there is always a moment that challenges me to reframe how I think about the work we do. This year’s Long Arm of the Law session did exactly that. It was a vivid reminder that the legal and policy currents swirling around us are not abstractions; they shape our ecosystem in ways we can’t afford to ignore. Paul Rosenzweig set the stage with a fascinating and lively walk through the history of executive orders. Hearing that Washington issued just eight while later presidents relied on them more frequently primarily to advance political agendas made the evolution very real. What stood out was the fine line between legitimate executive authority and overreach, and how easily those boundaries can blur. Nancy Weiss then brought the conversation directly into our lane with her analysis of an Executive Order directing the Institute of Museum and Library Services (IMLS) to reduce its activities to the bare legal minimum. Her experience as former General Counsel gave us an inside view of what such a directive could mean for libraries, museums, and cultural programs, all places where so much of our community’s work takes root. Sessions like this are why Charleston continues to be invaluable to me. They stretch my understanding, give me new context, and remind me that staying informed is part of how we navigate change together. Data-Driven Insights: The 2025 Author and Researcher Survey Lori Carlin My week was cut unusually short (for me) by other meetings I had to fly off to, but I still managed to squeeze in 2.5 days of interesting sessions, discussions, and ‘business casual’ gatherings. The first two events I attended this year were definite highlights, both of which were the brainchild of and brilliantly orchestrated by my colleague, Heather Staines – the Vendor Meetup on Monday evening and the Leadership Breakfast on Tuesday morning. Both were jam packed and filled with lively conversation. If you’re not familiar, the Vendor Meetup is an open, casual gathering (sponsored this year by Get FTR) designed to give vendor representatives, especially early career attendees, who attend only for Vendor Day a chance to socialize and network, something they often miss when they’re in and out in a single day, but all are welcome to attend! The Leadership Breakfast, a smaller invitation-only event designed to give a more intimate networking experience within the larger Charleston Conference, is always a thoughtful session centered on a pressing issue of the day, and this year was no exception. The discussion focused on sustainability across the entire scholarly communication ecosystem—from funders to libraries to publishers. Frankly, no one can unhear the words of one of the panelists (a library director) when he commented that his budget has dropped from ~$7M to ~$5.4M in the last 24 months … with more to come. Finally, I’m a little biased, but I dare say I and my panelists were very pleased with the session I moderated focused on the impact of US research funding changes, which highlighted info from Delta Think’s Spring 2025 Author and Researcher Survey, along with how publishers who participated used the data to inform their strategies. We also had a librarian on the panel who informed the audience about the impact of these changes on universities overall and libraries in particular. As you may know, the survey data showed rising concern about institutional support, with many researchers rethinking how they publish and participate in conferences. Respondents also described how tightening budgets are straining peer review and research dissemination, while responses varied sharply between U.S.-based and international authors, reflecting distinct policy and institutional pressures, it also showed that the impact is being felt globally. In the tradition of Charleston, what made the session so powerful was the discussion. Colleagues from societies, publishers, and libraries focused on how they are using these insights to understand the challenges and to act on them. From adjusting publishing strategies to helping researchers to growing relationships in other markets, to shaping advocacy and outreach activities, organizations are using these insights to inform resource and budget direction in innovative ways. For me, that was the real takeaway: turning evidence into collaboration, and progress. Even in uncertain times. We’re running the survey again now with plans to compare results to the Spring version. If you’re interested, there is still time to sign up! End of An Era (Two, in Fact!) This year’s conference marked a pivotal moment: the first without the in-person presence of founder, Katina Strauch (though we were grateful for her virtual participation), and the well-earned retirement of longtime Conference Director Anthony Watkinson, who rang his iconic bell one last time. We would not be here without them and their visionary colleagues who built this community from the ground up. Thank you, Katina and Anthony. Charting What Comes Next If there was one metaphor that captured Charleston 2025, it was motion; not adrift, but deliberate progress in the face of resistance. From policy updates to AI integration to the enduring strength of the scholarly community, the week’s sessions affirmed that innovation often takes root during uncertainty. As Tony Hobbs reminded us, even headwinds can propel us forward — if we learn how to adjust our sails.
By Heather Staines November 6, 2025
We are proud to share a video recording of our October News & Views companion online discussion forum! Join us for our annual update on the volume and revenue associated with Open Access publishing. If you missed the session, or if you attended and would like to watch/listen again, or share forward with friends, please feel free!
By Dan Pollock and Heather Staines October 21, 2025
Overview After a rocky couple of years, the open access (OA) market may be finding its footing again. Each year, Delta Think's Market Sizing analyzes the value of the OA scholarly journals market—that is, the revenue generated by providers or the costs incurred by buyers of content. Our analysis estimates that the OA segment expanded to just under $2.4bn in 2024. Although growth has improved compared with last year’s deceleration, it continues to lag behind the broader historical trend for OA. The proportion of articles published as OA has declined slightly, likely driven by continued reduction in the output from the large OA publishers. This trend has benefited established publishers, who saw growth in OA activity and revenue as they continued to consolidate their positions. Looking ahead, OA could soon begin outpacing the broader journals market once again—but likely through different growth drivers than in the past. Read on to see what those shifts might look like. Headline findings Our models suggest the following headlines for the 2024 open access market:
By Lori Carlin & Meg White October 13, 2025
Collaborate with Delta Think to uncover how funding and policy uncertainty continue to reshape the research ecosystem — and gain tailored insights for your community.