News & Views: Publishers and Market Consolidation – Part 1 of 2

This month we present the first part of some results of big data analysis of the scholarly publishing industry. We look at the latest data sources to tease out information about numbers of publishers and consolidation of the industry.
Background
At the start of 2022, the Open Alex data set was launched. It combines data from multiple sources, including the (now unsupported) Microsoft Academic Graph, CrossRef, Unpaywall, the DOAJ, ORCID, and PubMed. It weighs in at 1.6 Terabytes, with several hundred million records covering papers, authors, institutions, and more. Analyzing it is not for the faint-hearted and requires big data tools and techniques.
Delta Think is now using it to analyze the entire scholarly landscape. We apply some clean-up to normalize publisher names and link with our data on APCs, societies, and public sources of journal metrics. We can then use it to look at patterns across all journal access types, and we will be using it to inform our 2022 OA market sizing process.
By way of illustration, we thought we’d look at what it can tell us about the basic structure of the scholarly publishing industry.
How many publishers are there?
The data suggest that in total there were a little over 16,780 publishers in operation between 2000 and 2021, publishing around 121,700 journals. The numbers have grown over the years. There are just under 10x the number of publishers now than in 2000, compared with 4.4x the number of journals (and around 4.1x the number of articles).
With so many publishers in operation, the market has interesting dynamics, as shown below.
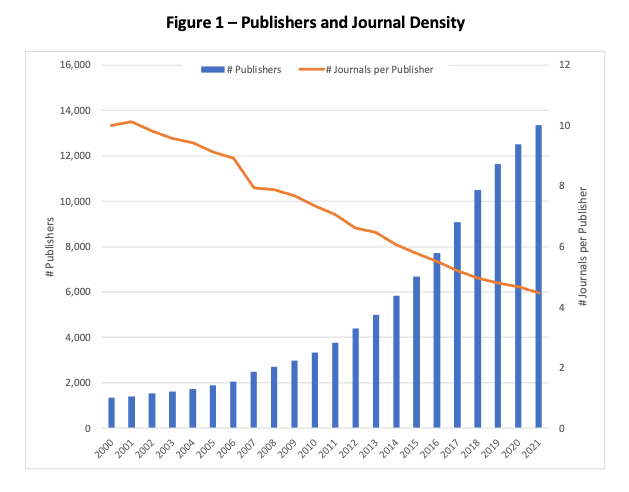
Sources: OpenAlex, Delta Think analysis. © 2022 Delta Think Inc. All rights reserved.
The chart above shows how the numbers of publishers have grown over the last decade (the blue bars). But notice how the average number of journals published by each (the orange line) has halved.
The data suggest that publishers now publish an average of 4.5 journals each – down from ten at the start of the century.
Of course, we know that there are many publishers that publish more than a handful of journals. We analyze this further below.
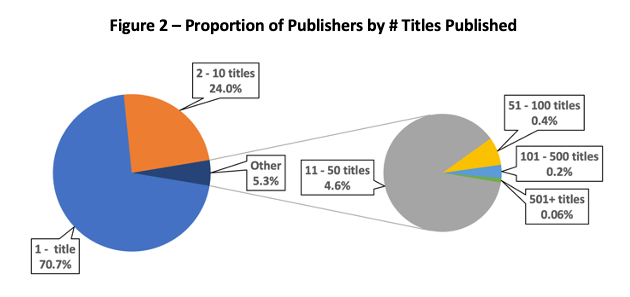
n = 13,361. Sources: OpenAlex, Delta Think analysis. © 2022 Delta Think Inc. All rights reserved.
The chart above shows the proportion of publishers that published various numbers of journals in 2021.
- The left-hand pie shows that just under 95% of publishers publish 10 journals or fewer. 71% of publishers publish only 1 journal; 23% publish between two and ten journals.
- The remaining 5.3% of publishers are shown in the right-hand pie: 5% publish between 11 and 100 journals (grey and yellow segments combined). 0.26% publish – about 34 or so – publish more than 100 titles.
So, our average 4.5 journals per publisher is made up of a few large publishers plus a very long tail of smaller ones. To put this in further context, we can see how the thresholds above translated into volumes of output.
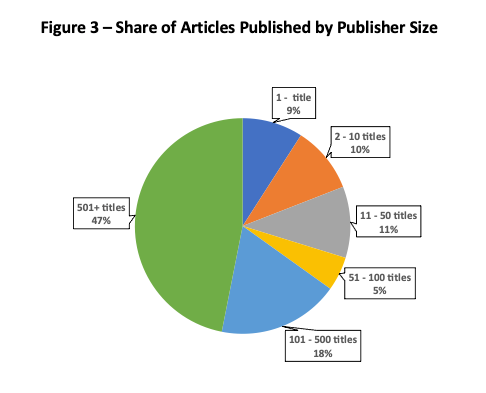
n = 4.18 million. Sources: OpenAlex, Delta Think analysis. © 2022 Delta Think Inc. All rights reserved.
The chart above looks at how all the articles published in 2021 were shared between publishers of various sizes. We use the same size buckets as the previous chart, and refer back to it.
- Reading clockwise from 12 o’clock, the (71% of) publishers who published one title each accounted for 9% of total article output. Those publishing between two and ten titles accounted for 10% of total output, and so on.
- Notice how the large publishers dominate: 47% of total output is produced by the 0.06% of the publishers who publish 500 titles or more. Just under two thirds of all articles are produced by those publishing more than 100 titles.
Conclusion
That our market is highly consolidated is probably not surprising. But the extent of the polarization – and the length of the long tail – might be. Half of total scholarly output is published by just 10 publishers, each of whom publish 400 or more journals. 80% of that is accounted for by the top 5.
The underlying data allows us to analyze trends over time. We will examine trends in more depth in part 2 of this analysis. It reveals some interesting results about how the degree of consolidation is changing.
Weighing in at 1.6 Terabytes, and with hundreds of millions of records, analyzing the data is a formidable task. The analysis above is just a taste of what’s possible. We have examined the whole market here, but we can dice and slice by article or journal types, to break out open access or subscriptions. We can also break the data down by subject, etc. We will look into the best way to make interactive versions of the data available to our subscribers over the coming months.
Methodology notes
The data basically cover “anything with a DOI”. We process the underlying OpenAlex data to group together common variations in publisher names. We include only research articles. We exclude repositories and data with no stated publisher or year.
This article is © 2022 Delta Think, Inc. It is published under a Creative Commons Attribution-NonCommercial 4.0 International License. Please do get in touch if you want to use it in other contexts – we’re usually pretty accommodating.