News & Views: Falling Dollar, Rising Prices

Dan Pollock & Heather Staines • May 20, 2025

After our previous analysis of the effects of inflation on APCs, we received a question about the effects of currency exchange rates. At a time when the dollar’s exchange rate is changing rapidly, what effect might that have for organizations buying services from abroad?


Background


Each year we survey the list Article Processing Charges (APCs) of more than 30 major and significant publishers. Going back to 2015, the dataset includes more than 20,000 unique titles and 150,000 title per year combinations. We have previously seen how headline prices typically increase each year, but mostly fall in real terms, once inflation is accounted for.


After our most recent analysis, we were asked by a US-based institution whether our inflation numbers included currency effects. With the US dollar (USD) having weakened over the last few months, the institution found buying services priced in non-USD currencies to be significantly more expensive by the end of April 2025 compared with the start of the year.


We take a snapshot of APCs at the same time each year. To compare like-for-like across our global market, we normalize prices to USD. This practice is commonly used by economists when analyzing global data and happens to be the most commonly used currency in our sample. Many non-US publishers – especially larger ones – offer an option of USD prices alongside their native currencies (and perhaps others). So, we sample USD prices where quoted, which cover on average around 94% of our annual samples of around 15,000 journals. Otherwise, we convert the prices cited in the publisher’s native currency into USD using the average exchange rate the most recent full year available.


Effects of changing exchange rates


Our analysis of price changes includes the effects of annual changes in exchange rates for the subset of around 6% of non-USD journals in our sample. It also includes any changes made by non-US publishers to their USD prices. However, it does not include the effects of significant and quick changes to exchange rates. Given the volatility in the US dollar over the last few months, we can dig deeper to explore the impact of these changes. And are there winners and losers depending on who’s buying or selling?


Sources: LSEG Data & Analytics, US Treasury, Publishers’ websites (Dec 2016, Jan 2018-Jan 2025), Delta Think analysis. © 2025, Delta Think Inc. All rights reserved.


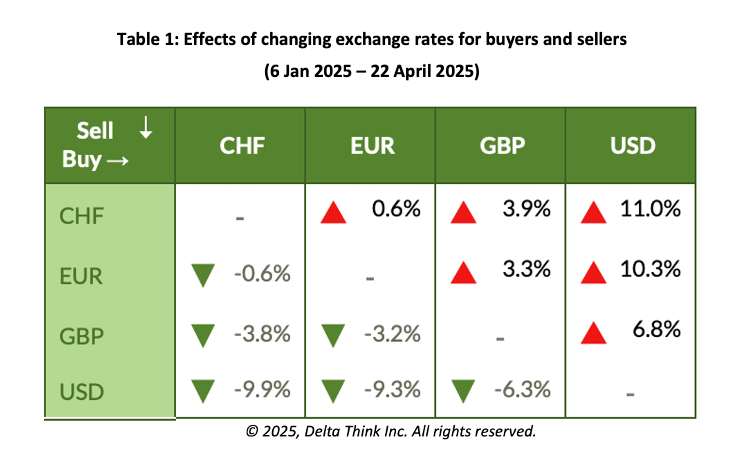
The figure above shows the effects of changing foreign exchange (FX) rates on purchases for different combinations of currencies.


  • The rows show the currency in which prices are set, representing the seller. The columns show the currency of the buyer. The data show how exchange rates have changed between January 6, 2025, and April 22, 2025.
  • For example, a US-based organization using USD (right-most column) to buy services priced in CHF (Swiss Francs, first row), will have seen the cost of fees increase by 11% between the two dates. The weaker dollar means more dollars are needed for the same price in CHF.
  • Of course, the reverse is true. So, a Switzerland-based organization using CHF (left-most column of data) to buy services priced in USD (bottom row) will find things to be cheaper by 9.9%.
  • Our color-coding takes the perspective of buyers (red/up-arrows more expensive, green/down cheaper), reflecting the original question we were asked.
  • Note how things have become significantly more expense for those buying using USD over the 15 weeks spanned by the table.
  • To put the numbers in context, going into 2025, average APCs rose by 3% across our annual sample, which translated to a fall of 2.7% in real terms.
  • The table represents a snapshot in time, to illustrate how profoundly costs might be affected by changes in exchange rates. As exchange rates fluctuate throughout the year, so will the costs.


Long term effects


We have looked at the last few months, but how does the picture look over the longer term?


n=125,164. Sources: LSEG Data & Analytics, US Treasury, Publishers’ websites (Dec 2016, Jan 2018-Jan 2024), Delta Think analysis. © 2025, Delta Think Inc. All rights reserved.


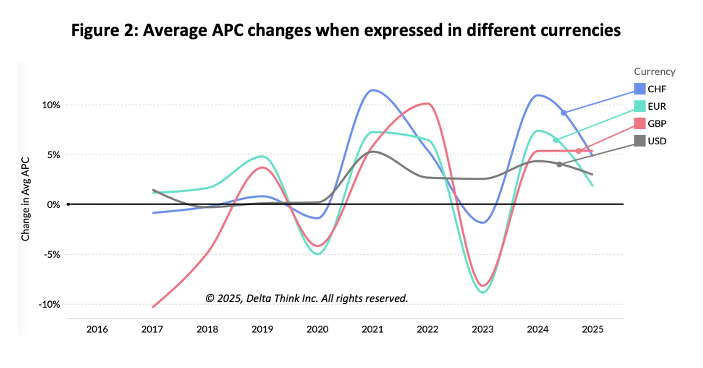
The figure above compares the annual changes in average APCs when expressed in different currencies.


  • The baseline is the USD (grey) line, which shows our headline changes as we normally depict them.
  • The other lines show what happens if we convert our average USD APCs to other currencies using the average exchange rates for each year. We use the averages for the most recent full year just ended. So, e.g. the 2025 changes are based on average FX rates for 2024.
  • Note how the prices may shrink or grow at significantly different rates depending on the currency. For example, going into 2023 average prices increased if priced in USD, but fell if priced in other currencies.
  • The chart analyzes changes in prices and so is affected by changes in exchange rates. For example, just before and after Brexit in 2016, the Pound’s (GBP) value fell. As it then stabilized to a less volatile range, its annual changes moved more in line with other currencies.
  • Although not shown on the chart, our analysis suggests that, as a rough guide, if the strength of the dollar falls, average APCs in non-USD currencies increase, and vice versa.


Conclusion


To the question of whether our inflation analysis incorporates currency effects, the answer is “partly”. Our annual sampling method does not resolve short-term changes, which are not included. Annual averages in exchange rates only affect a few percent of prices in our long-term tracking and thus are included in our headline changes. If exchange rates impact the Consumer Price Index (CPI), then they would form part of inflation and impact our real-terms benchmarks.


Whatever the methodology, the real world is moving quickly. Recent rapid and significant changes in the value of the dollar have made it more expensive for US institutions to buy from outside the US. Our analysis shows the profound effects of a weaker dollar on APCs over a period of just 15 weeks.


Where publishers offer prices only in their local currencies, costs for US-based institutions have increased by more than 10% in some cases. These costs don’t directly translate into higher margins for publishers and vendors – they are just an increased cost of doing business. Of course, non-US buyers benefit from cheaper prices (which may feed through to margins). Meanwhile, non-US vendors offering US prices may see less value coming into their organizations when USD purchases are converted to balance sheets in local currencies (which may also affect margins). Larger organizations may have hedging strategies in place, but these can only go so far in highly volatile markets.


Scholarly publishing is a highly global and widely distributed industry, so volatile currency effects are nothing new. We have previously explored how exchange rates can profoundly affect market values. Many large corporate organizations report their finances both with and without currency effects so investors can see what changes in the currency markets mean. Our long-term analysis here shows how changes in currency rates regularly affect price swings – both for better and worse. Global disruption has been the new normal, with Brexit, COVID, and the war in Ukraine as just a few of many examples.


We don’t yet know how far the dollar will fall, or whether it will bounce back. Crises seem to be unfolding in real time – for example, the India/Pakistan escalated and de-escalated during the preparation of this piece of analysis. For those wrestling with budgets, we can only suggest baking in some contingency for exchange rates. Things may get worse before they get better.

---


This article is © 2025 Delta Think, Inc. It is published under a Creative Commons Attribution-NonCommercial 4.0 International License.

Please do get in touch if you want to use it in other contexts – we’re usually pretty accommodating.


---

TOP HEADLINES


Duke University Press to publish open access monographs through MIT Press’s Direct to Open (D2O) – May 6, 2025


"The MIT Press is proud to announce that beginning in 2026, Duke University Press will join our Direct to Open (D2O) program. This collaboration marks the first such partnership with another university press for the D2O program, and reaffirms our shared commitment to open access publishing that is ethical, equitable, and sustainable."


COS Launches Call for Developers to Enhance Open Science Framework with Support from NSF – May 1, 2025


"The Center for Open Science (COS) has issued a Request for Proposals (RFP) inviting open-source development teams and independent developers to collaboratively enhance the Open Science Framework (OSF) as part of the National Science Foundation's Pathways to Enable Open-Source Ecosystems (POSE) program."


Notice of Updated Effective Date for the 2024 NIH Public Access Policy – April 30, 2025


"NIH’s default position is maximum transparency regarding research and research findings. This Notice updates the Effective Date of the 2024 NIH Public Access Policy, NOT-OD-25-047, to July 1, 2025 at which time it will replace the 2008 Public Access Policy. All other aspects of the Policy remain the same."


OA JOURNAL LAUNCHES


Journals in Taylor & Francis collective funding pilot reach target for full open access publishing - April 28, 2025


"Taylor & Francis has confirmed both journals in its innovative pilot, Collective Pathway to Open Publishing (CPOP), will be converted to open access (OA) for 2025. Announced in November 2024, CPOP has been devised as an alternative OA model for Humanities and Social Sciences (HSS) journals, particularly those focused on regions with a high uptake of OA agreements."


By Heather Staines April 20, 2026
We are proud to share a video recording of our March News & Views companion online discussion forum! Each year, this session brings the community together for a data-driven look at article processing charge trends, market dynamics, and what the latest data signals for publishers, societies, funders, and institutions. If APCs factor into your strategy, pricing, or planning for the year ahead, this webinar offers insights grounded in longitudinal data and practical analysis. If you missed the session, or if you attended and would like to watch/listen again, or share forward with friends, please feel free! 
By Lori Carlin & Meg White April 16, 2026
What happens when the value of your content is extracted, summarized, and delivered via an AI tool … and the audience stops there? As highlighted in The Scholarly Kitchen , this emerging dynamic, known as “the Crocodile Effect,” places AI systems between publishers and their audiences, consuming value while limiting downstream engagement. Recent data underscores the problem and urgency to address it. Publishers across industries – not just scholarly – are seeing dramatic declines in traffic, and AI-driven upstream interfaces, though growing, contribute only a fraction of overall referrals. At the same time, emerging “zero-click” behaviors on search engines, social media, and AI driven platforms are conditioning users to expect answers without leaving the platform. This dynamic is particularly acute in scholarly publishing: highly structured, fact-rich content is uniquely susceptible to being summarized, recombined, and delivered elsewhere. This creates a growing threat to how publishers capture and sustain value from their content through audience engagement. What’s at stake for scholarly publishers The implications go well beyond traffic metrics for scholarly publishers. The traditional model depends on a chain of value: discovery → access → engagement → monetization (via subscriptions, APCs, licensing, advertising, institutional relationships, etc.). AI summaries disrupt that chain at the very first step. When key findings, data points, or interpretations are surfaced directly in AI interfaces: Attribution becomes diluted , weakening brand recognition and authority. Engagement declines , reducing usage along with opportunities for deeper reading, citation, and reuse. Monetization pathways erode , particularly where metrics like cost per download (CPD), impressions, and click through rate (CTR) are used to determine value, collection development, and ad spend. Content integrity risks increase , as summaries may omit nuance, context, or limitations critical in scholarly work. In effect, publishers are providing the foundation for the knowledge economy without benefit, while AI platforms capture increasing portions of the user relationship. What can you do in response? Delta Think partners with publishers to address these issues, focusing on the following strategic areas related to usage and engagement: 1. Reassess what constitutes “value” in your content If core insights can be summarized and consumed elsewhere, publishers must emphasize elements that are harder to replicate. The question shifts from “How do we get clicks?” to “What experiences require coming to us?” 2. Strengthen direct relationships with audiences Invest or partner in channels where there is visibility. Developing strategies that involve your society networks, institutional integrations, and researcher and author workflows allow you to maintain direct engagement with readers and authors. 3. Optimize for visibility within AI ecosystems Conduct research to evaluate how your content is represented and implement recommendations to address problem areas. This includes assessment and development of metadata strategies, structured content, licensing approaches, and partnerships that ensure accurate attribution and appropriate use. 4. Explore new monetization and licensing models Identify the right approaches and determine the right deals for your content, while maintaining overall portfolio integrity. 5. Differentiate through utility and trust Lean into this by establishing your market positioning as an essential destination for validation. Establish your voice based on voice-of-the-customer market research methodologies to ensure your messaging establishes you as the authoritative source for verification, context, and deeper understanding. 6. Monitor and measure emerging referral dynamics Identify and implement new ways of tracking influence, reach, and downstream impact beyond clicks to demonstrate and quantify your value. What’s Next: Work with Delta Think to Turn the AI Threat into an AI Benefit Delta Think has expertise in all the areas outlined above. We ensure organizations develop actionable strategies to address current market changes and dynamics. The rise of AI-mediated discovery and zero-click experiences is an active and accelerating shift that requires evidence-based decision-making today. This is where Delta Think thrives. Our expert insights provide publishers with the data needed to understand where their exposure to AI-driven disintermediation is greatest, how usage patterns are evolving across channels, and which strategic responses are most likely to drive sustainable value. This includes identifying where traffic loss is most acute, where new forms of engagement are emerging, and how content, data, and licensing strategies must adapt in response. Delta Think can guide you in the development of a successful strategy that ensures the sustainability of your publishing program. Lori Carlin and Heather Staines will be attending the upcoming STM Annual Conference (April 22-23, Washington, DC) and SSP Annual Meeting (May 27-29, Chula Vista, CA), and Heather will be at the 2026 CSE Meeting (May 3-5, Durham, NC), so please reach out to set up a check in and continue the conversation. Not traveling this spring? We are always available at info@deltathink.com .
By Dan Pollock & Heather Staines April 7, 2026
This month we examine our latest data about Article Processing Charges (APCs). Per article pricing is a fundamental building block for all paid publishing models, so our review provides an invaluable insight into how the cost of open access continues to evolve. APC prices in general continue to increase, but at a slower rate compared with this time last year. Important nuances in the distribution of prices continue to affect the value and cost of paid publishing models. Background Each year we survey the list price Article Processing Charges of a sample of more than 40 scholarly publishers. Our dataset covers more than 20,000 titles dating back to 2016 and represents one of the most comprehensive reviews of open access pricing. To compare like for like, we consistently analyze non-discounted, CC BY APCs. We take a snapshot annually in January, so we can track yearly changes while controlling for publisher price changes throughout the calendar year. Our statistics here exclude zero or unspecified APCs, although these are present in our underlying data (and available to our subscribers). This allows us to capture trends where publishers choose to charge APCs without skewing averages. We run separate analyses around APC-free models. Headline Changes Going into 2026, we see APC prices increasing, but the percentage increases continue to fall back to track long-term trends. Fully OA APC list prices across our sample have risen by around 6.8% compared with 6.4% this time last year. Hybrid APC list prices have risen by an average of 5.3% compared with 3% this time last year. Maximum APCs for fully OA journals remain at $8,900. Maximum APCs for hybrid journals now top out at $12,850 (up $160 from last year). Average APC prices have increased more this year than last year. However, the increases remain lower than the highs of a couple of years ago. Underlying trends continue. Average APC price increases are getting larger each year. There are approximately 2.4x more hybrid journals than fully OA ones, down from 2.6x last year, and 2.9x a year before that. The proportion of journals that are hybrid is slowly falling. However, because they are the majority, hybrid journals follow (or, rather, set) a similar pattern to the market overall. On average, fully OA prices are around 67% of those of hybrids – consistent with long-term trends. Around 24% of our sample of fully OA journals charge no APCs, compared with 22% last year. (We have separately analyzed the number of articles in OA journals.) Price increases vary significantly by discipline. Fully OA Arts and Humanities journals saw larger than average increases; Multidisciplinary journals saw lower than average increases. Price Distribution Market-wide headline price changes mask important nuances. We have discussed previously that the most important nuance lies in the spread of prices within a given publisher’s portfolio. For example, if the bulk of a publisher’s journals lie towards the lower end of its APC pricing, with just a few journals priced at the higher end, the average (mean) price will be higher than most authors pay. The following figures show how the spread of APC prices plays out in the market across our sample of publishers. The figures are outlines of histograms, showing how many titles sit in various price bands over the successive years of data we have curated. The red line shows the most recent year’s prices. The lines become more green as they go further back in time. Subscribers to Delta Think’s Data & Analytics Tool can see full details of the Number of Titles and Price Band axes. Hybrid Prices The spread of price bands for hybrid journals is shown in Figure 1 below.
By Lori Carlin & Meg White March 25, 2026
In Spring 2025, approximately 13,000 researchers told Delta Think that they were bracing for disruption tied to potential U.S. funding cuts and policy changes. Now with the results of our Fall 2025 Global Author/Researcher Survey, we have a second data point and an early longitudinal view of what is changing, what is persisting, and what may be becoming structural. Delta Think partnered with 40 scholarly organizations across both surveys, collecting more than 25,000 responses from researchers across disciplines, career stages, and 125 countries. This scale allows us to move beyond a snapshot of sentiment and begin identifying sustained patterns in how researchers are responding. The findings are straightforward: while the initial shock has eased, underlying pressures remain. From Initial Reaction to Sustained Constraint Compared to earlier in 2025, researchers report a modest softening in how they perceive the impact of funding uncertainty. While there are variations across the disciplines, the sentiment is more measured and overall concerns remain high. Across both surveys, the same concerns persist, and, critically, researchers are beginning to adapt their behavior in response. The joint findings point to a system that is not rebounding; it’s recalibrating under sustained pressure: Funding concerns remain deeply embedded. Researchers across both waves continue to highlight funding stability and long-term research viability as primary concerns, suggesting these are perceived as ongoing constraints rather than short-term disruptions.  Research capacity is being reallocated. Researchers report shifting time and effort toward securing funding, often at the expense of publishing and peer review. This signals pressure on both research output and the systems that support it. Global engagement is stabilizing at a lower baseline. Some of the sharper reactions seen in Spring 2025, particularly internationally, have moderated. However, researchers continue to reassess publishing, collaboration, and conference participation decisions, with financial and geopolitical considerations still shaping behavior. What This Means for the Research Ecosystem Taken together, these patterns suggest the research community is not in acute crisis, but it is not returning to prior norms either. Instead, we see early evidence of a more constrained operating environment taking hold, one where funding uncertainty continues to influence attitudes as well as day-to-day decisions about publishing, participation, and collaboration. For publishers, societies, and research organizations, this distinction matters. Temporary disruption can be managed tactically. Sustained constraint requires strategic adjustment across pricing, portfolio strategy, engagement models, and advocacy. What’s Next: Evidence for Strategic Decision-Making Delta Think focuses on turning evidence into strategy. Our work is designed to help organizations ground decisions in real market data and signals, supporting informed planning in rapidly evolving environments. Our Fall 2025 survey represents the second phase of an ongoing annual research initiative. By continuing to track these dynamics over time, we aim to provide Scholarly Communications with the evidence needed to understand where there are shifts, where change is accelerating or stabilizing, what patterns are beginning to emerge, and what changes are likely to persist. The full findings from our surveys, including deeper analysis, segmentation, and exploration of the trends are available to participating organizations and through access to our full report. If you’d like to learn more, see the complete results, or participate in our next survey, please reach out at: info@deltathink.com .
By Lori Carlin & Meg White February 26, 2026
Trust is what allows research to function. It enables collaboration, supports editorial decision-making, and underpins the credibility of the scholarly record. Today, that trust is increasingly being tested. Competitive pressures, new forms of manipulation, and rapidly evolving technologies are raising both the volume and complexity of integrity risks. And our community is responding with clearer standards, better training, smarter workflows, and responsible innovation, strengthening the systems that protect confidence in science and scholarly publishing.  The STM Research Integrity report makes clear that the community is fully engaged. Publishers have invested heavily in dedicated teams, screening technologies, and workflow integration, and are focused on proactive prevention. However, the report does highlight a persistent challenge: expectations around research integrity are rising faster than many organizations’ ability to define, implement, and operationalize them consistently The gap between expectation and execution is where many publishers and societies are now focused. Defining What “Good” Research Integrity Practice Looks Like One of the report’s central insights is the diversity of approaches publishers have taken to building research integrity capacity. Team size, tool adoption, workflow design, and policy scope vary widely—often for good reasons related to scale, discipline, and business model. However, this diversity also makes it difficult for organizations to answer basic questions internally: What does “good” look like for us? Which capabilities are essential now, and which can follow later? How do we know whether our current approach is proportionate to the risks we face? The STM report shows that effective integrity practice is about ensuring that policies, processes, and systems are coherent and fit for purpose. Translating this into action requires clear frameworks that help organizations define integrity expectations in ways that are realistic and aligned with their publishing context. Turning Policy into Day-to-Day Practice Integrity infrastructure only works if it is deployed consistently across the publication lifecycle. Clear policies must be supported by screening checkpoints, escalation pathways, investigation protocols, and well-defined roles for editors, integrity teams, and external partners. In practice, many organizations struggle at this stage. Policies may exist on paper but are unevenly applied. Screening tools may generate signals without clear guidance on interpretation. Editors may be unsure when and how to escalate concerns. The report illustrates how publishers who have made the greatest progress have focused on integration—embedding integrity checks into submission, peer review, revision, and pre-acceptance workflows, and ensuring that staff and editors understand how these pieces fit together. Achieving this level of operational clarity requires deliberate design. Investing in Technology Without Losing Human Judgement Technology plays a central role as an enabler rather than a solution. Tools surface signals; people make decisions. Managing false positives, avoiding workflow bottlenecks, and maintaining editorial confidence remain ongoing challenges. For publishers and societies, the practical questions are how to select, combine, and govern tools so that they best support existing processes. The report underscores a foundational tenet of Delta Think’s consultancy: evidence-based decision-making is paramount in understanding what tools will deliver in practice, what processes will best interact with workflows, and where additional human expertise is required. From Expectation to Implementation Research integrity is an operational capability that publishers and societies are defining, building, and most importantly, need to continuously refine. Research Integrity ‘success’ will depend on a combination of tools, services, processes, and training consistently refined and applied. This is where Delta Think’s focused, evidence-led approach can make a tangible difference. We work with publishers and societies to interpret sector expectations, assess current vs. best-in-class capabilities, and design innovative roadmaps. Reach out today to discuss how we can partner to ensure your research integrity practices and processes are performing at peak efficiency and effectiveness.
By Dan Pollock & Heather Staines February 10, 2026
This edition of News & Views looks at the changing patterns of license use over time. Are licenses becoming more or less permissive and what are the implications for scholarly publishers? Introduction Last month we compared the patterns of license use as reported by the members of the Open Access Scholarly Publishers Association (OASPA) with those observed in the wider scholarly journals market. Our comparison looked at the aggregated total numbers of licenses during the years 2015-2024. This showed a useful snapshot of the complete 10-year period spanned by the data. But how has the use of license types changed over that time? This month we dive into the temporal changes, focusing on the core scholarly journals market based on data in our Data and Analytics Tool (DAT). DAT allows for multiple comparisons and in-depth analysis, and, in this edition of News & Views, we highlight a couple of interesting examples of trends over time. The different types of OA licenses We start by focusing on only Open Access (OA) journal output. Many funders and institutions mandating OA also insist on certain OA license types, typically more permissive CC0 or CC BY licenses (to be consistent with the foundational Budapest Open Access Initiative ). However, more restricted licenses, such as those prohibiting commercial or derivative use, are also broadly used. For the purposes of our analysis, we define these as follows. “Permissive” refers to articles published under CC0 or CC BY licenses. These are the ones defined as required by major OA advocates, such as Plan S , Wellcome , HHMI , etc. “Restricted” refers to articles published under other licenses that allow limited reuse, such as CC BY-NC (non-commercial), CC BY-ND (no derivatives), or publisher-specific licenses. Although not conforming to the strictest OA mandates, such licenses are widely used and are consistent with many mandated OA requirements. Publishers sometimes charge lower APCs for these more restrictive licenses compared with their permissive counterparts. Data comparing the use of permissive vs. restricted licenses in open access output is shown below.
By Lori Carlin & Bonnie Gruber January 29, 2026
Building on last Spring’s survey of authors and researchers, we are once again analyzing responses from a large, global community to understand how shifts in the funding and policy environment are affecting research activity, priorities, and outlook. Conducted in partnership with 32 organizations, the Second edition of our Author–Researcher Survey was designed explicitly as a continuation of the work conducted in Spring 2025, allowing us to again take the pulse of authors-researchers, track emerging trends, and identify early signals related to real and perceived changes in U.S. science policy and research funding. With 12,122 completed responses from researchers in 125 countries , the Second survey again provides a robust and diverse dataset. Analysis is ongoing and the high-level structure of the respondent pool is already clear, closely mirroring, while subtly extending, what we observed in the Spring of 2025. A Global Community, with the U.S. at the Center of the Conversation The most recent respondent pool again reflects a truly global research community. Just over half of respondents are based in the United States, with others reporting from a broad range of countries worldwide. This near-even U.S./international split remains one of the defining features of the dataset and is particularly important given the survey’s focus on U.S. policy and funding dynamics. The results continue to underscore that changes originating in the U.S. research system are global in scope, closely watched and widely felt well beyond national borders. Science-Heavy Participation Anchored in Physical, Life, and Health Research Physical sciences represent the largest single area of engagement, alongside strong representation from the life sciences, health sciences, and engineering and technology. Social sciences and the arts and humanities account for a smaller share of responses, and as in prior responses, many participants report working across multiple fields. This pattern reflects both the interdisciplinary reality of modern research and the continuity needed to support meaningful year-over-year analysis. Insights Shaped Largely by Mid- and Senior-Career Researchers Mid- and senior-career respondents make up the majority of the sample, complemented by a substantial cohort of early-career researchers and representation from graduate and doctoral trainees. This reinforces that much of the insight emerging from the survey reflects the perspectives of researchers with long-term experience navigating funding cycles, institutional change, and strategic research planning. That experience is also evident in respondents’ professional roles. Faculty members and principal investigators account for the largest share of participants, alongside researchers, analysts, postdoctoral fellows, and graduate students. Clinically active professionals—including physicians and other healthcare providers—are also represented. The overall role mix remains highly consistent as compared to the Spring group, strengthening confidence that shifts observed in attitudes or behavior are not driven by changes in who is responding. Why This Continuity Matters One of the most important features of this current dataset is how closely its underlying demographic structure aligns with the Spring survey results. This consistency strengthens our ability to interpret changes in sentiment, expectations, and reported actions as genuine signals rather than artifacts of sampling. The scale and international reach of the most recent responses allow us to surface new nuances, particularly around how researchers are adapting to evolving policy signals, funding uncertainty, and institutional responses. What Comes Next We are digging into the full results to explore how researchers’ outlooks have evolved, including: Whether perceptions of funding stability and risk are shifting How researchers are adjusting research scope, timelines, or collaboration strategies Persistent signals related to mobility, field-level vulnerability, and longer-term confidence in the research enterprise Decisions about research funding, policy, and scholarly communication increasingly require evidence, not assumptions. Delta Think’s research process is designed to provide the scholarly communication community with the rigor, scale, and transparency needed to build sustainable strategies in an uncertain environment. From survey design through analysis and reporting, our approach emphasizes methodological consistency, careful segmentation, and openness about what the data can support. By maintaining continuity year over year, we aim to surface credible trendlines that stakeholders across the research ecosystem can trust. The Delta Think team designed this initiative to gather data and to support our partners across the scholarly ecosystem. By combining rigorous research design with deep industry context, we help publishers, societies, and institutions make informed, strategic decisions during periods of significant change. If you’re interested in learning more about the findings or discussing how they apply to your organization, we’d welcome the conversation. Please email Lori Carlin to get started.
By Dan Pollock & Heather Staines January 13, 2026
Overview This month we look at the changing mix of licenses in use among OASPA members and what these trends reveal for open access publishing more broadly. Introduction Each year OASPA surveys its member organizations to gather information about the volumes of output they publish in their fully OA and hybrid journals. These data provide a useful lens on how the most OA-committed publishers are approaching licensing and how that compares with the market as a whole. We’re delighted to be working with OASPA on its survey again this year. We process the raw data into consistent categories, normalize publisher names, and create visualizations of the data over time. We also produce a yearly blog post in cooperation with OASPA, outlining some of their results. Because space constraints limit what can be covered in OASPA’s own post, we explore additional angles here, placing OASPA member behavior in the context of Delta Think’s wider, market-level analysis. Subscribers to our Data and Analytics Tool can investigate the data further still. Our work with OASPA provides a complementary view into our market-wide analysis. Use of Licenses We can examine which common open access licenses are in use, as follows. 
By Lori Carlin December 4, 2025
Impelsys and Delta Think Join Forces to Expand Strategy and Technology Capabilities for Publishing, Scholarly Communications, Education, and Healthcare Communities
By Dan Pollock and Heather Staines December 2, 2025
Overview Each year, our scholarly market sizing update and analysis goes way beyond open access headlines. One consistent finding is that market share of open and subscription access is highly dependent on subject area. This month we look at how to best use our Delta Think Data and Analytics Tool (DAT) to understand and analyze these variations. With coverage of approximately 220 detailed subject areas, the data shows that headlines can sometimes mask important detail. Background Since we began our scholarly journal market analyses in 2017, one of our core objectives has been to enable deep analysis of our headline findings. Our annual market share updates represent a summing of data – more than 200 detailed subject areas, 200 or so countries, also split by society vs. non-society journal ownership. This level of detail is clearly too much for our monthly short-form analyses, so we present the market-wide headlines in our annual updates. However, by picking one subject area as an example, we can see how much nuance lies beneath the surface, and why these variations matter. Subscribers to DAT can use our interactive tools to quickly and easily see each level of detail and filter for just those relevant to their organization. Market Share Variation by Subject Area Our latest market headlines suggested that open access (OA) accounted for just under 50% of article output in 2024. However, this headline proportion varies considerably by subject area.