News & Views: How reliable are the headlines you read in reports?

A number of sources provide information about patterns in the overall scholarly journals market. However, as we so often mention in our analyses, important nuances lie beneath the headlines. This month we explore just how much variation exists and highlight the importance of specificity.
Background
As part of our annual market updates, we estimate the proportions of open vs. subscription access content each year. Over the last few years, we have observed how OA has approached 50% of output, but we note that it has yet to punch through that number. However, this headline varies greatly depending on your area of publishing.
An example from physics
The chart below shows the nuances across just a few of the 200+ subjects that we track.
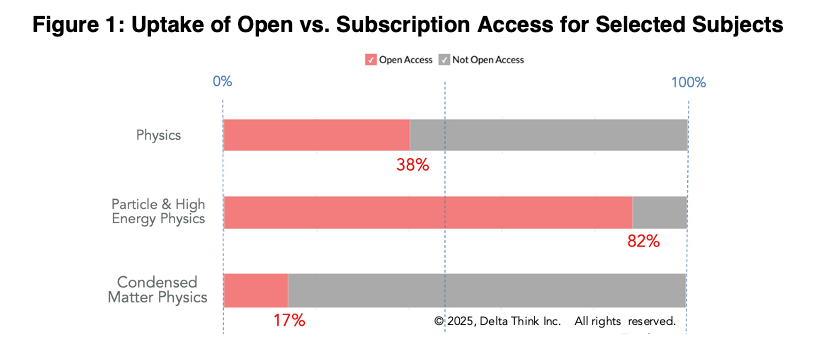
Sources: OpenAlex, The Register for Scientific Journals, Series and Publishers, ANZSRC, Delta Think analysis.
The chart above shows share of output across all physics output, compared with two disciplines within physics:
- Each bar shows proportions of open access (pink, left) compared with subscription access (grey, right) within each corresponding subject.
- The whole of physics showed a 38% uptake of open access, compared with the slightly over 50% uptake total across the entire market.
- Particle and High Energy Physics (HEP) saw an 82% uptake of OA.
- Condensed Matter Physics saw an OA uptake of 17%.
Clearly, large variations exist compared with market-wide averages, and even within the one discipline of physics.
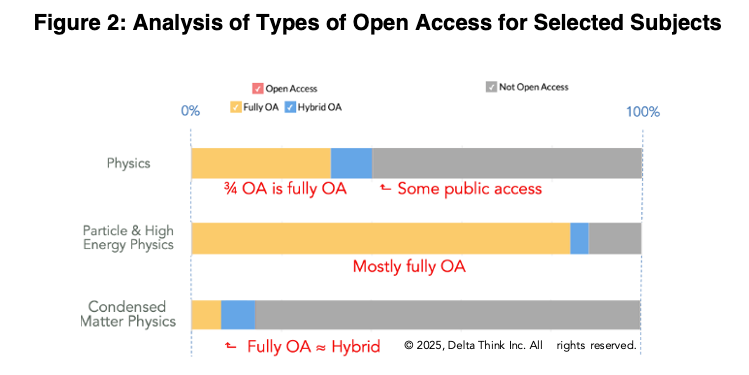
The chart above shows how the uptake of OA is composed: share of output as before, but breaking out the open access share:
- As before, each bar shows proportions of uptake within each corresponding subject listed. Reading left to right, the leftmost (yellow) share shows the proportion of output in fully OA (“Gold”) journals, the middle (blue) shows the share of output that is OA in hybrid journals, and the rightmost (grey) shows the share that is not OA (subscription).
- About 75% of all physics OA is in fully OA journals (compared with around 78% for all subjects, not shown above).
- But 90% of HEP is fully OA, while the fully OA is split 50:50 within Condensed Matter Physics.
So, we clearly see that the make-up of open access also varies significantly depending on discipline.
Conclusion
Overall market headlines give a useful sense of trends and evolution. They are simple and lend themselves well to the limited space available in static industry reports.
However, as we can see, the figures for a publisher or journal can differ wildly. Even within specialty publishing, there are wide variations.
We track over 200 subjects, a number which won’t conveniently fit into most reports. Interactive tools address this limit and allow us easily to drill into specifics. Here we covered subjects within physics. The same principles apply from medical sub-specialties, through to other sciences, and to AHSS.
To find out how the changing patterns in business models affect your organization or journal, it’s therefore vital to drill into the specifics, and move beyond the simple headlines.
Please get in touch to find out more.
Sources: OpenAlex, The Register for Scientific Journals, Series and Publishers, ANZSRC, Delta Think analysis.