News & Views: APC Price Changes – When does up mean down?

In the wake of COVID-19, publishers and librarians alike are experiencing and anticipating budget cuts. Understanding the true effects of price rises is now more critical than ever. However, understanding what price changes mean is not straightforward. This month, we explore why headline APC price increases can be misleading…and could even lead to less spending.
General principles
Our analysis was inspired by a recent study which called out some large increases in APCs by one publisher. Our intention is not to single out the publisher, nor to criticize the study. Looking at headline price increases is always a key step in planning budgets. If a large proportion of a publisher's journal APC prices increase, then on the surface this suggests buyers will pay more overall.
However, headline APC increases do not show the whole picture. As we have explored previously, it is important to put numbers in context.
We analyzed APC changes across our data set of 30+ publishers, covering about two thirds of indexed output, to see how the patterns scale across the market. We have chosen results from three publishers which illustrate how different data points can lead to different conclusions. In the spirit of neutrality, we have anonymized the results, we avoided the publisher referenced in the study, and we have omitted measures of scale. All the publishers in our sample publish significant numbers of journals and volumes of content. Table 1 shows the results, which we explain below.
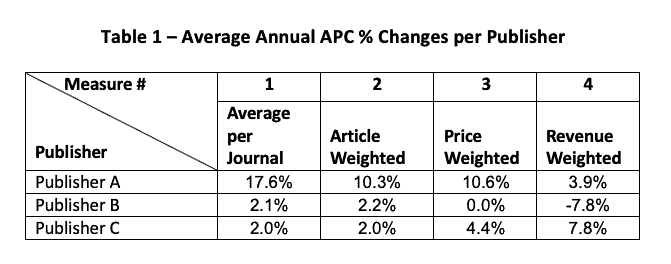
Sources: Publishers’ price lists, Unpaywall, ISSN.org, Delta Think analysis.
Choosing the right measure
Let’s look at Publisher A and consider each of its measures.
- The % APC increase for each of its journals averages to an inflation-busting 17.6%. At first glance this appears to be a significant price increase.
- But APCs are charged per article. By factoring in the number of articles, we can see how much more might be paid for any given paper. The average APC of a paper increased by 10.3%. In other words, a relatively large volume of papers for this publisher are published in journals with more modest price increases. This is still large, but much less so than the headline increase.
- Of course, percentages are relative. A large % increase on a small price may have only a mild effect on total spending and vice versa. If we scale our averages to prices, we see prices on average shifted by 10.6%. The high journal price increases are likely skewed across the lower-priced journals. This has the net effect of reducing the impact of the headline increase.
- Finally, if we combine article weightings with price weightings (items 2 and 3), we get the final column. This is indicative of the change in spending across the publisher’s entire portfolio. It shows a net increase of a much more modest 3.9%. We see a multiplier effect between article and journal weightings.
What does this mean for you?
The distributions and papers published can make a huge difference to how much money might be spent. The principles can be applied to other publishers, and to libraries or consortia analyzing their submissions. To illustrate this, we look at the other publishers’ figures in the table above.
A. Publisher A (as we saw above) showed how high headline per-journal increase may translate to something more modest when scaled up.
B. Publisher B shows a variation of this. A modest price increase of 2.1% on average translates into a significant decreasein spending of almost 8%. Why? Our averages may include journals whose prices have reduced too. If a significant proportion of papers are published in these journals, then their combined savings more than offset the price increases across the other journals.
C. Publisher C shows the reverse. A modest price increase of 2.0% on average this time translates into an almost 8% increase in potential spending. The modest increases are likely spread across the publisher’s pricier journals.
Conclusion
Headline APC price changes can belie the true impact of pricing on total spend.
As we have mentioned in previous analyses, the spread of prices within a given publisher’s portfolio is an important factor in understanding total spend. So too is the volume of papers affected by the price change. We need to combine different data to unpick how headline price increases might translate into total expenditure or revenue (for buyer or seller respectively.)
This all requires good data of course. By combining multiple data sets at scale, we can see what price changes mean for a publisher, or across an institution. Given data specific to an organization, we could further tailor the analysis to meet its specific situation. Canny operators can use the principles to optimize their pricing positions – whichever side of the negotiating table they sit.
Participants in negotiations of course want to present themselves in the best possible light. By combining neutral data at scale, we try to look behind the headlines and arrive at an objective conclusion that could be used as evidence acceptable to all.
This article is © 2020 Delta Think, Inc. It is published under a Creative Commons Attribution-NonCommercial 4.0 International License. Please do get in touch if you want to use it in other contexts – we’re usually pretty accommodating.