News & Views: Open Access Charges – Continued Consolidation and Increases

Each year we survey the list Article Processing Charges (APCs) of a sample of major and significant publishers. Covering over 18,000 titles, and going back to 2016, our data set represents one of the most comprehensive reviews of open access pricing.
Our market sizing has previously suggested that fully OA and hybrid prices are converging and consolidating. The latest analysis of list prices suggests that prices are now becoming more widely distributed as publishers optimize prices across their portfolios. Prices in general are increasing.
Headline Changes
To compare like for like, we analyze non-discounted, CC BY charges. Overall, list prices continue to increase slowly:
- Last year, high-impact journals began to offer OA options, which led to above-average price increases. This year, overall price increases have fallen back to their underlying averages.
- The highest prices for fully OA journals have risen from $5,560 to $8,900. The maximum is due to one outlier1: Cell Press’s Patterns (published by Elsevier). Springer Nature’s Nature Communications takes second place at $5,560. Otherwise fully OA (“gold”) journals usually top out at around $5,200 to $5,300.
- Outliers aside, Fully OA journal APCs are less expensive than hybrid, averaging around 59% of hybrid average APCs. Last year it was 58%.
- The average hybrid APC has increased by 3.6%. This is just over half the increase we saw last year, but remains larger than the 1% or so increases over the previous few years.
- The average fully OA APC has increased by 4.3% compared with the previous year. It falls back to a similar level to the year before last, after the above-average increases we saw last year.
Shifts Within Portfolios
Market-wide headlines mask nuances per publisher. Most of the larger organizations have increased both fully OA and hybrid average APCs. We have discussed previously that the most important nuance lies in the spread of prices within a given publisher’s portfolio. For example, if the bulk of a publisher’s journals lie towards the lower end of its pricing, with just a few journals priced much higher, the average (mean) price will be higher than most authors actually pay.
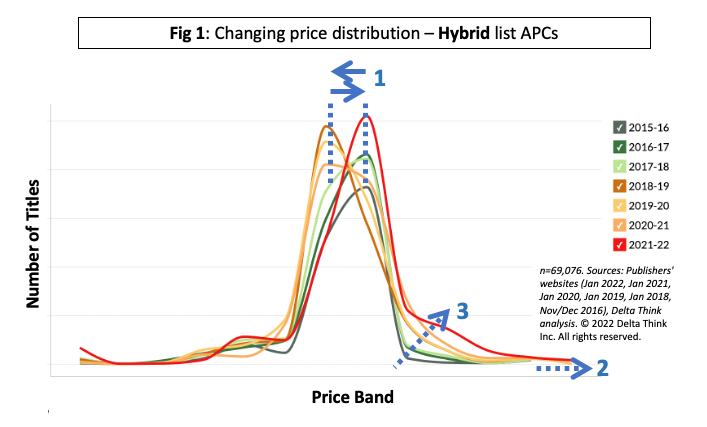
The following figures show how this plays out in the market across our sample of publishers. The figures are outlines of histograms, showing how many titles sit in various price bands over the seven successive years of data that we have. The red line shows the most recent year’s prices. The lines become greener as they go further back in time. Subscribers to Delta Think’s Open Access Data and Analytics Tool can see full details of axes.
For hybrid journals – shown in figure 1 below – the overall spread of prices has remained relatively constant over time. A few years ago, the most popular price band shifted slightly towards the lower end of the market and remained there for a few years (1). However, last year it moved back up to its historic highs. The highest prices increased last year (2). However, there are increasing numbers of journals at mid-to-high prices (3). Notice how the right-hand side of the curve is becoming shallower (3). This will have the effect of increasing average prices paid, as higher APCs are becoming more prevalent2.
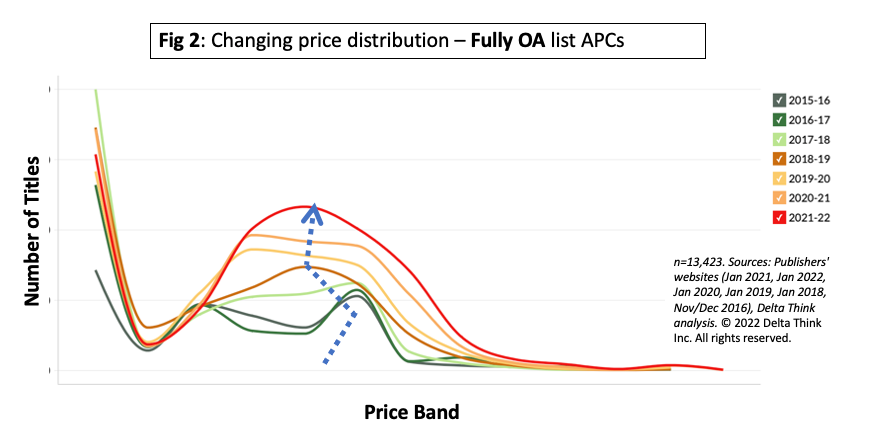
The fully OA landscape is shown in Figure 2. The extreme left shows journals without APCs ($0). This significant proportion of journals are sponsored, or their APCs are covered in some way that does not rely on authors arranging payments. Moving to the right, a few years ago (green lines), there was a double hump in the curve, suggesting two popular price bands. Over the last three years, the bands have merged into what amounts to a broad range of prices. Averages were getting cheaper over time, but last year they appear to be increasing. As with Hybrids, the popular band is widening, which will drive up the average APC paid.
Conclusion
Prices continue to rise, but there have not been the large headline price increases following the entrance of some of the expensive, high-impact journals we saw last year. However, as we noted last year, the outlying headlines don’t shift the market. The shifting and widening spread of popular price bands do.
As we explored at length in our analysis “APC Price Changes – When does up mean down?”, average headline price rises can lead to falling overall spend or vice versa, depending on the numbers of papers published and spread of price increases across a portfolio. An important variation of this is that making a few journals slightly more expensive could drive significant extra revenue for publishers.
Our study examines list prices. Mixed-model deals (RAP/PAR deals) are often calculated based on bundles. However, many deals are set by discounting from list APCs, especially where publication activity exceeds caps agreed. Therefore, the study of listed APCs continues to be relevant.
The APC market is continuing to mature. The shifting balance of prices and broadening of popular price bands suggest that publishers are now beginning to optimize their portfolios.
1 One other sibling journal (Cell Genomics) will also offer this maximum once its special introductory discount expires.
2 For clarity, the chart combines the very highest APCs into one band on the RHS.
This article is © 2022 Delta Think, Inc. It is published under a Creative Commons Attribution-NonCommercial 4.0 International License. Please do get in touch if you want to use it in other contexts – we’re usually pretty accommodating.